Cocconeis klamathensis
-
Category
-
Length Range15-44 µm
-
Width Range12-28 µm
-
Striae in 10 µm26-30
-
ContributorPat Kociolek - Feb 2011
-
ReviewerMarina Potapova - Aug 2013
Identification
Description
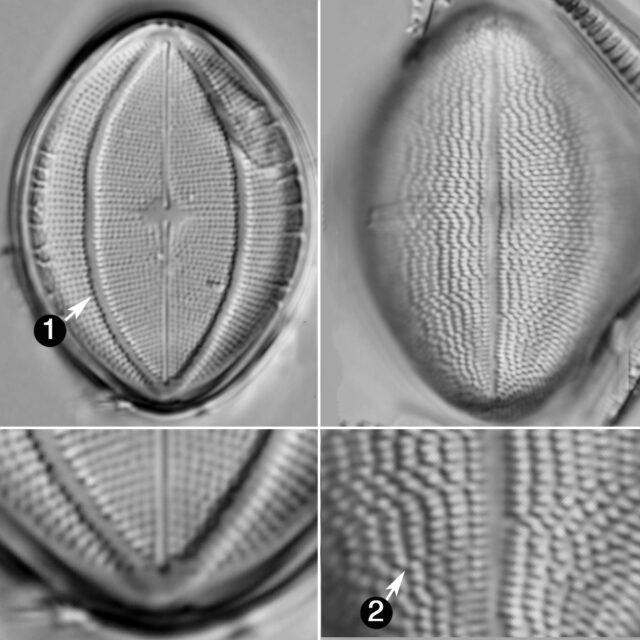
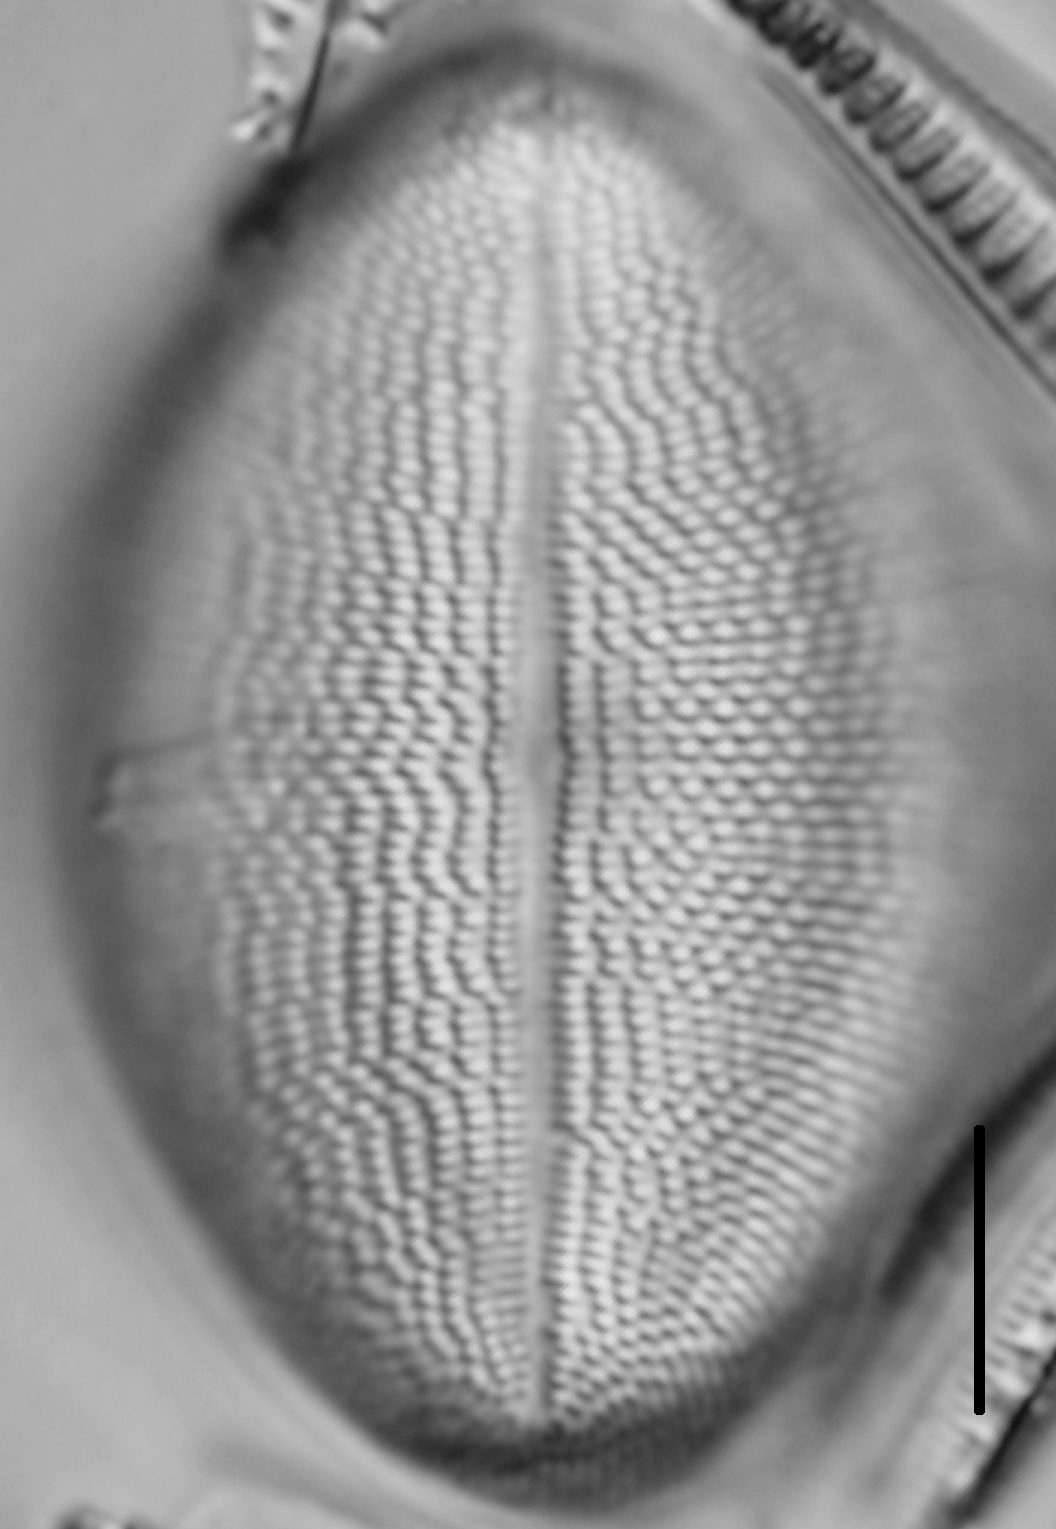
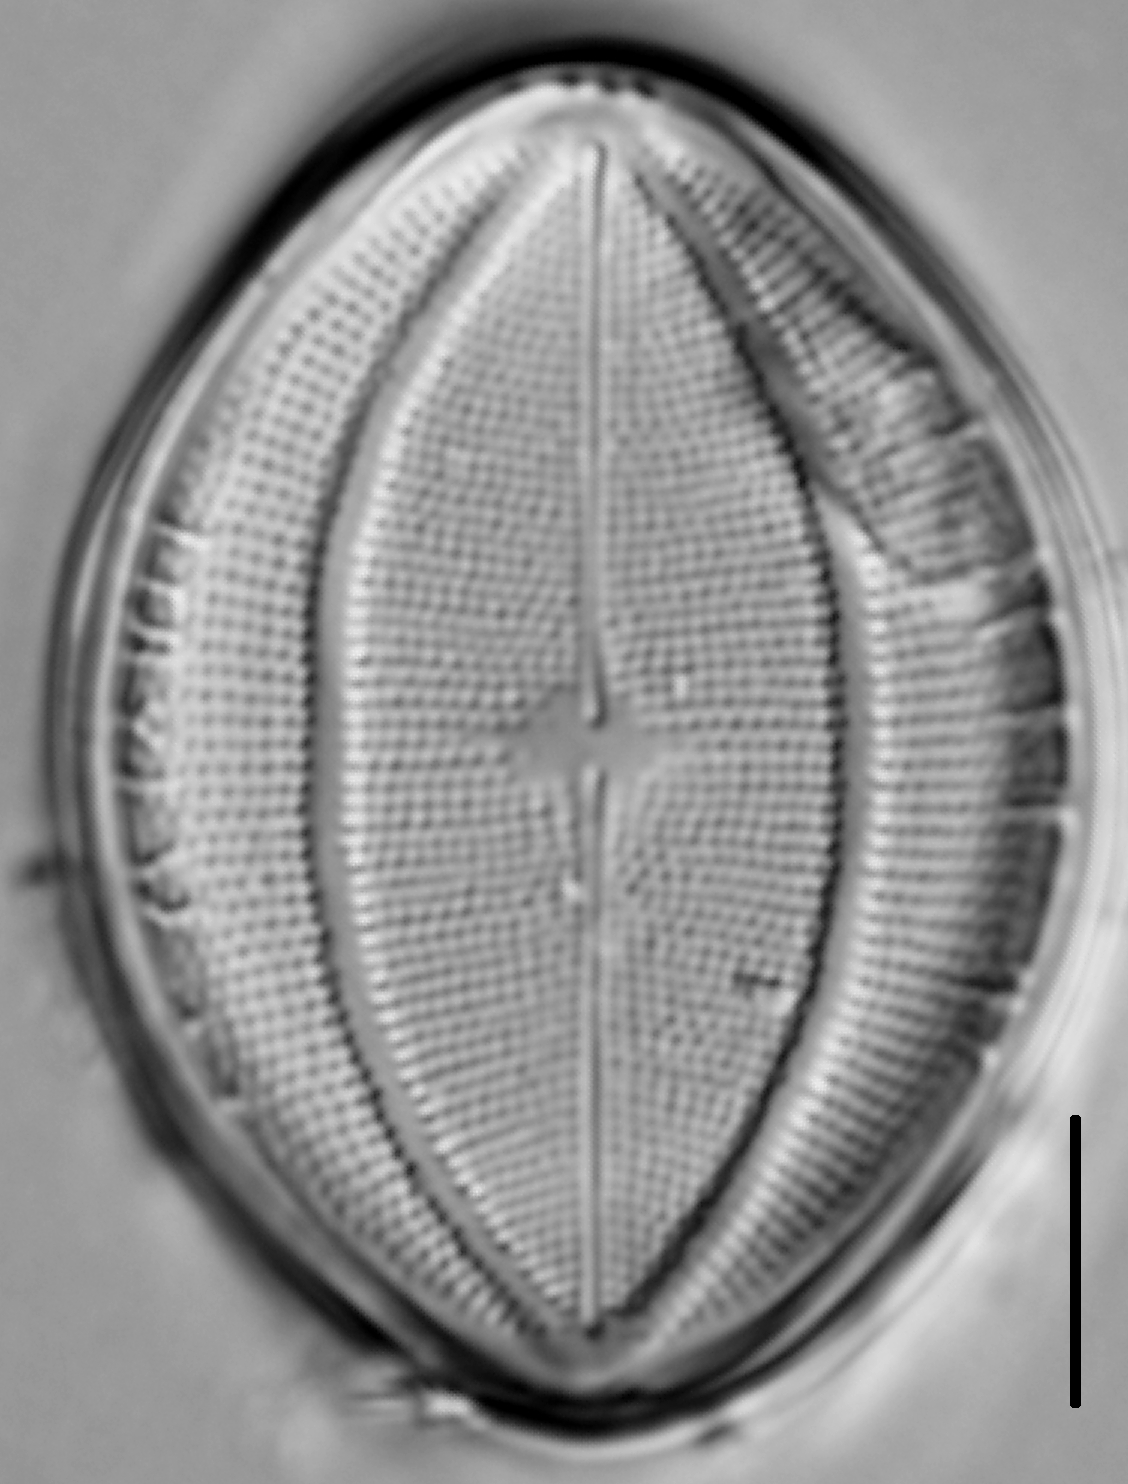
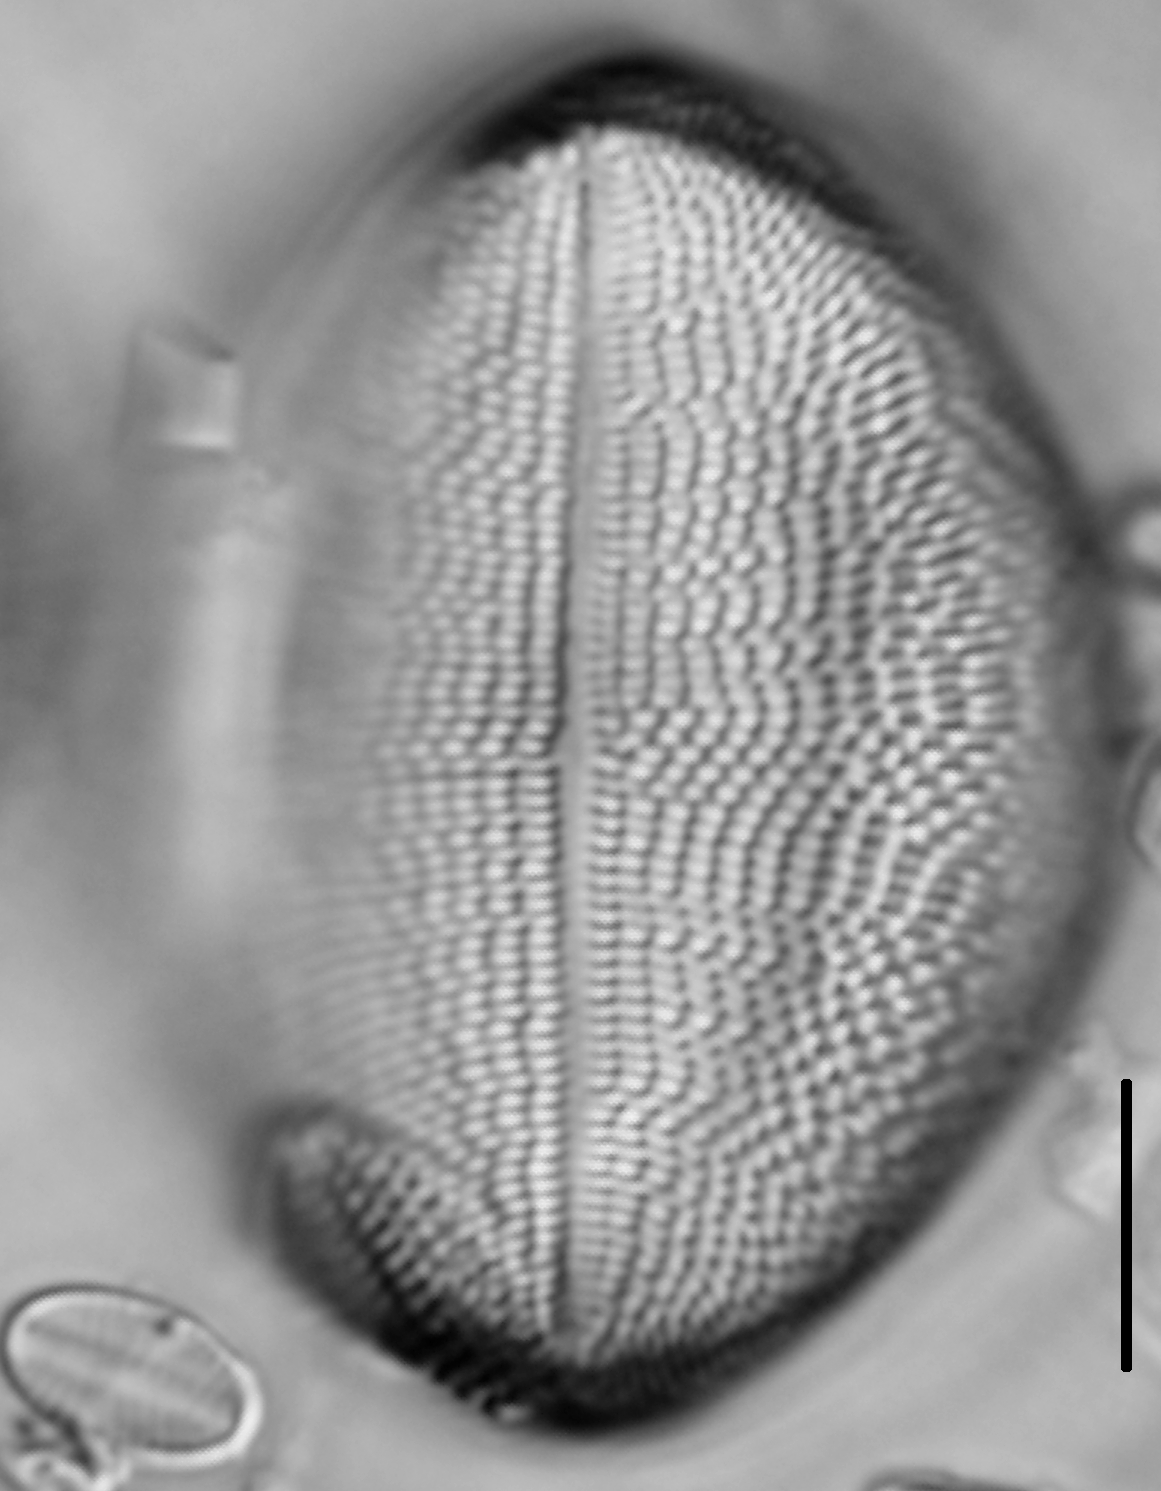
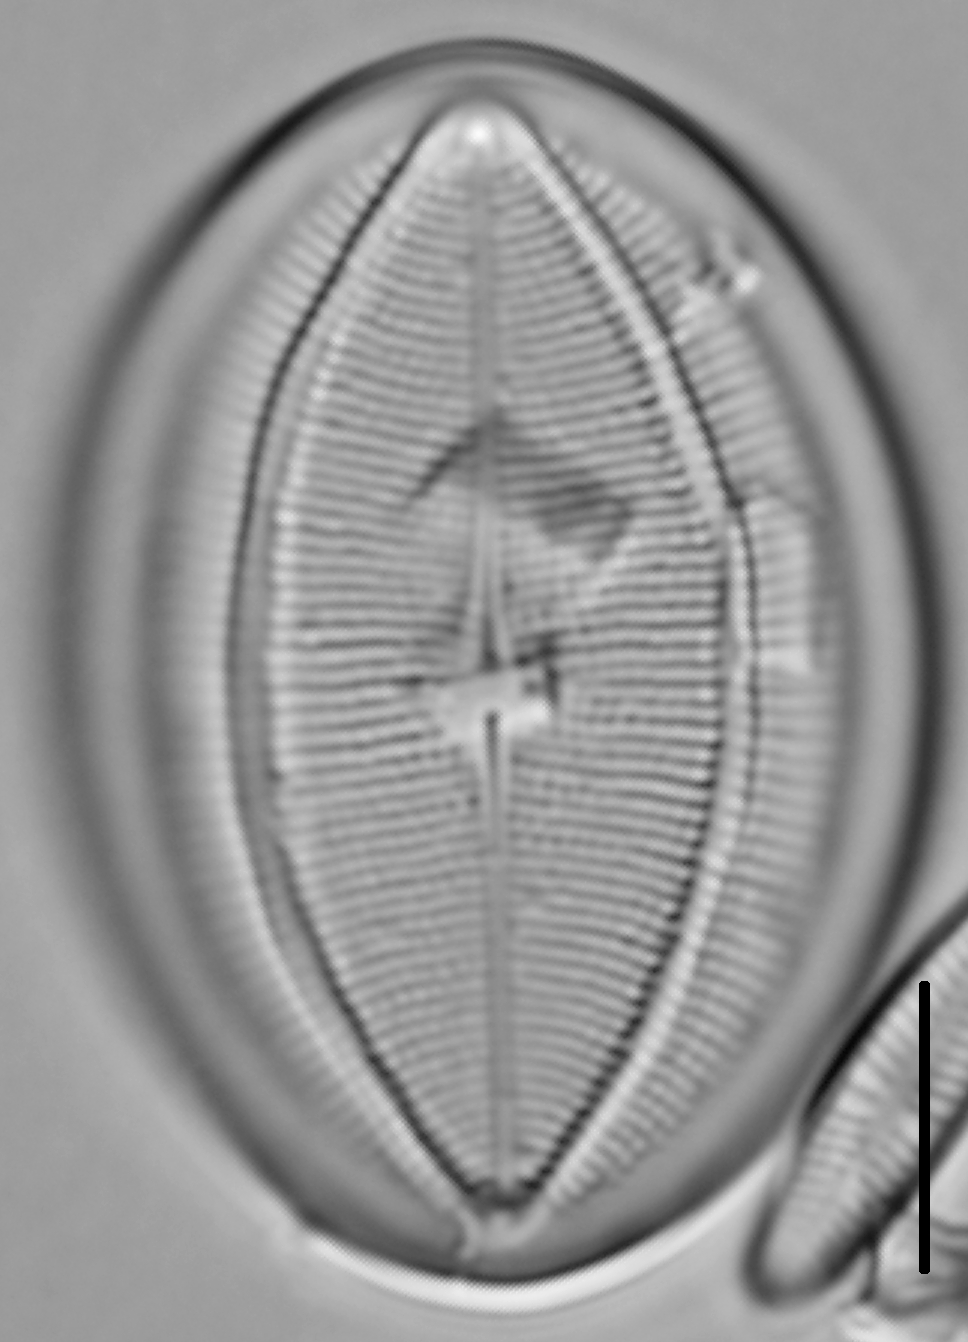
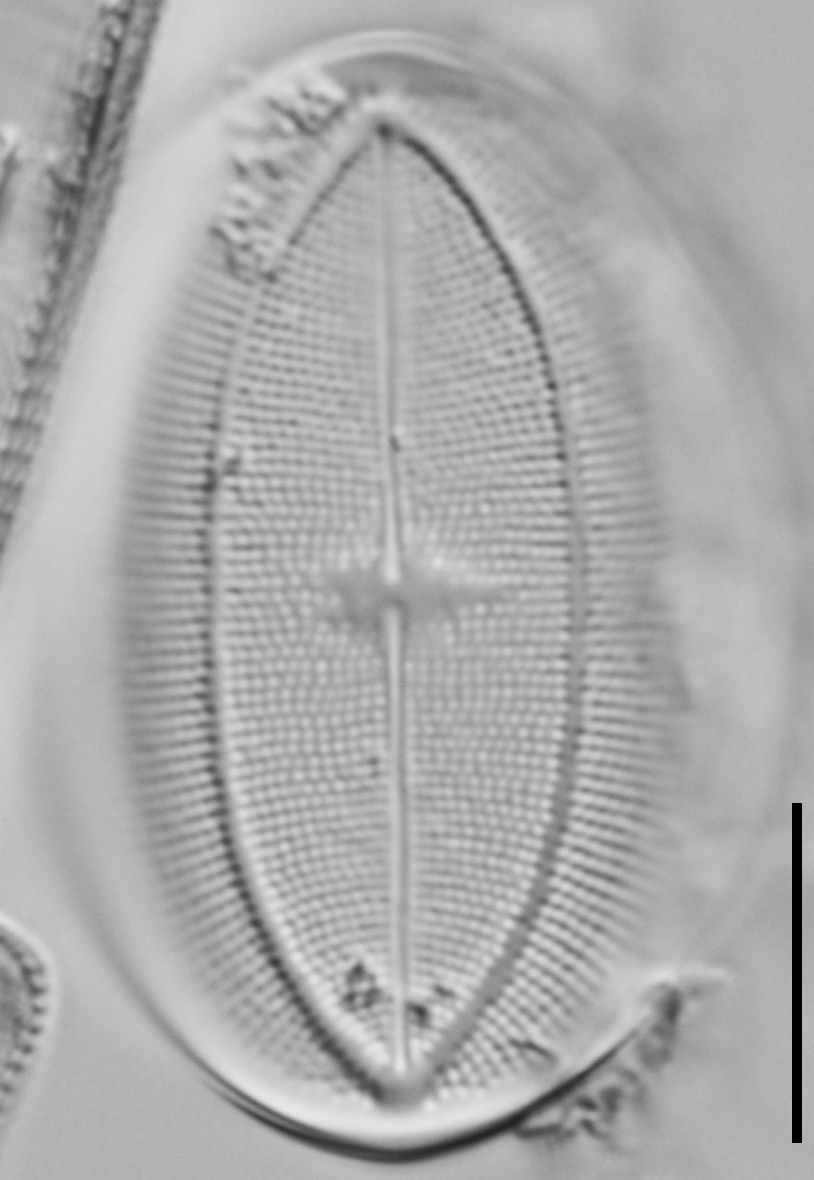
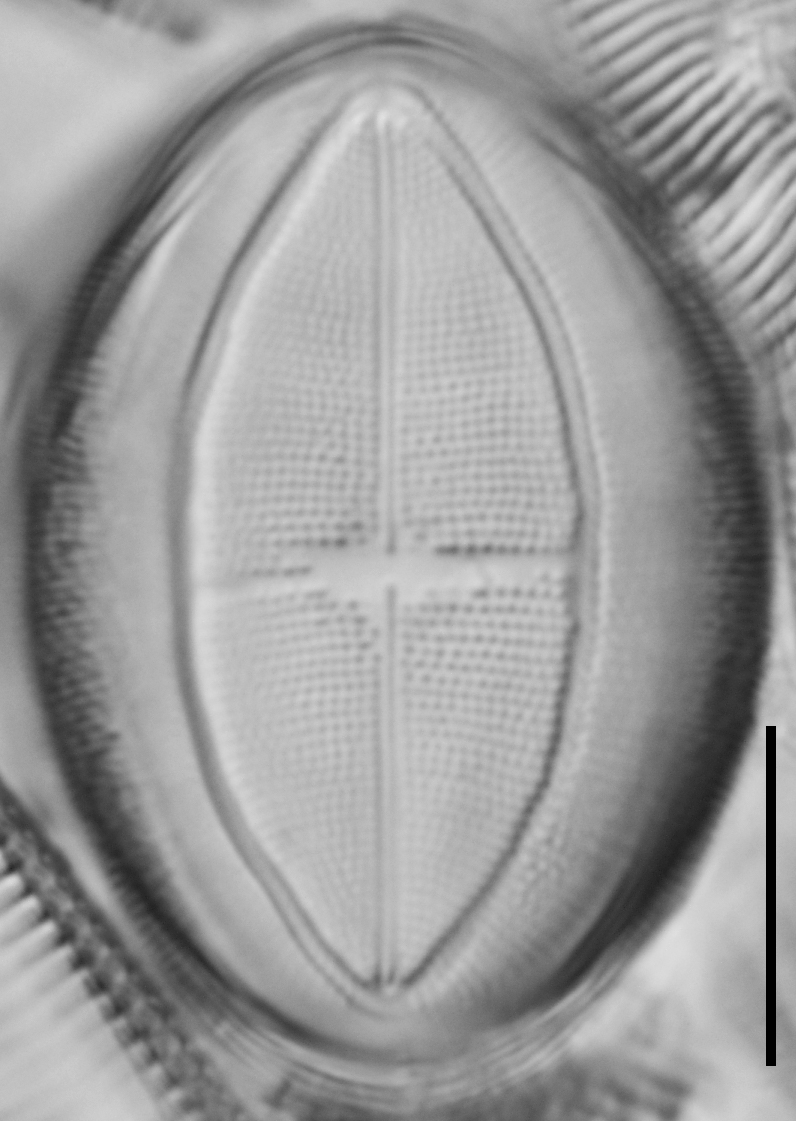
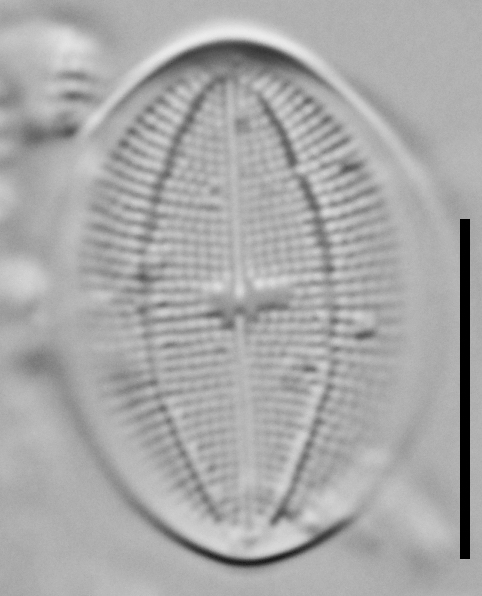
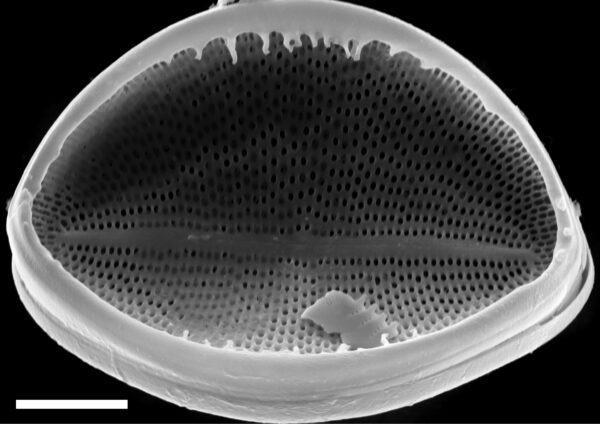
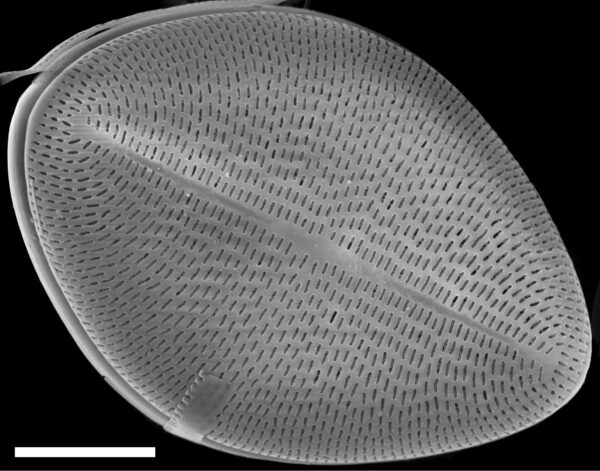
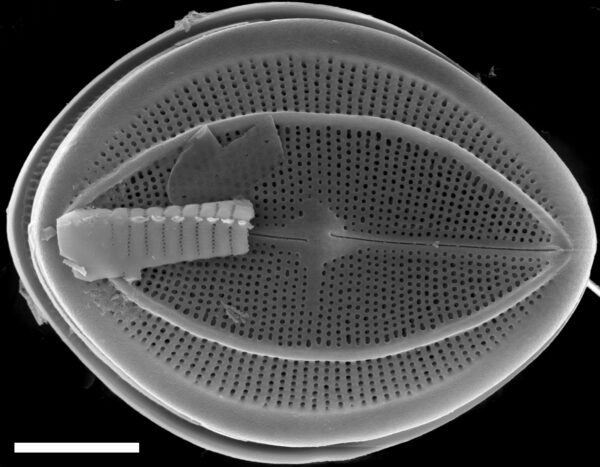
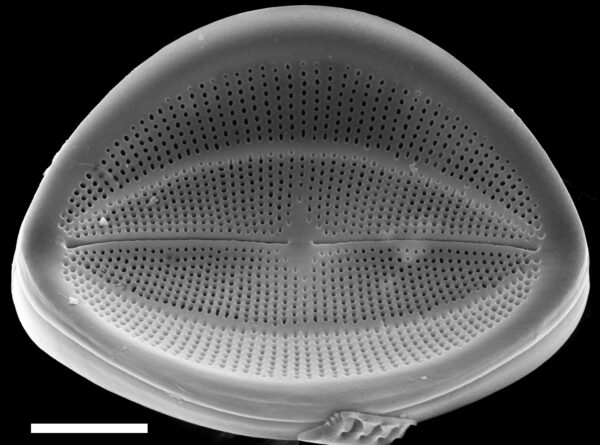
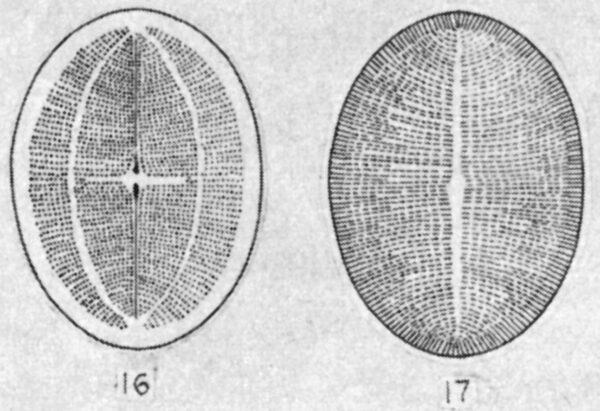
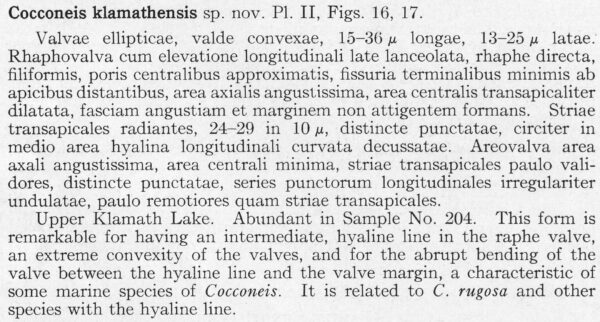
Valves are ellipitic in outline and strongly arched about the apical axis. The raphe valve has a narrow, linear axial area with a filiform raphe. The proximal raphe ends are dilated slightly. The distal ends are straight and terminate subterminally. There is a small, irregular central area. A hyaline area occurs on either side of the axial area and forms a naviculoid shape. Striae are fine, punctate, and radiate. The rapheless valve has a narrowly lanceolate central sternum. The areolae are dash-like and offset from one another.
Original Description
Cocconeis klamathensis sp. nov. Pl. II, Figs. 16, 17. Valvae ellipticae, valde convexae, 15-30 μ longae, 13-25 μ latae. Rhaphovalva cum elevatione longitudinali late lanceolate, rhaphe directa, filiformis, poris centralibus approximatis, fissuria terminalibus minimis ab apicibus distantibus, area axialis angustissima, area centralis transapicaliter dilatata, fasciam angustiam et marginem non attigentem formans. Striae transapicales radiantes, 24-29 in 10 μ, distincte punctatae, circiter in medio area hyalina longitudinali curvata decussatae. Areovalva area axali angustissima, area centrali minima, striae transapicales paulo vali- dores, distincte punctatae, series punctorum longitudinales irregulariter undulatae, paulo remotiores quam striae transapicales.
-
AuthorSovereign 1958
-
Length Range15-30 µm
-
Width13-25 µm
-
Striae in 10µm24-29
Original Images
Citations & Links
Citations
Links
-
Index Nominum Algarum
-
North American Diatom Ecological DatabaseNADED ID: 16014
Cite This Page
Kociolek, P. (2011). Cocconeis klamathensis. In Diatoms of North America. Retrieved April 16, 2024, from https://diatoms.org/species/cocconeis_klamathensis
Responses
The 15 response plots show an environmental variable (x axis) against the relative abundance (y axis) of Cocconeis klamathensis from all the stream reaches where it was present. Note that the relative abundance scale is the same on each plot. Explanation of each environmental variable and units are as follows:
ELEVATION = stream reach elevation (meters)
STRAHLER = distribution plot of the Strahler Stream Order
SLOPE = stream reach gradient (degrees)
W1_HALL = an index that is a measure of streamside (riparian) human activity that ranges from 0 - 10, with a value of 0 indicating of minimal disturbance to a value of 10 indicating severe disturbance.
PHSTVL = pH measured in a sealed syringe sample (pH units)
log_COND = log concentration of specific conductivity (µS/cm)
log_PTL = log concentration of total phosphorus (µg/L)
log_NO3 = log concentration of nitrate (µeq/L)
log_DOC = log concentration of dissolved organic carbon (mg/L)
log_SIO2 = log concentration of silicon (mg/L)
log_NA = log concentration of sodium (µeq/L)
log_HCO3 = log concentration of the bicarbonate ion (µeq/L)
EMBED = percent of the stream substrate that is embedded by sand and fine sediment
log_TURBIDITY = log of turbidity, a measure of cloudiness of water, in nephelometric turbidity units (NTU).
DISTOT = an index of total human disturbance in the watershed that ranges from 1 - 100, with a value of 0 indicating of minimal disturbance to a value of 100 indicating severe disturbance.
Cocconeis klamathensis
- Raphe valve with hyaline lines
- Areolae dash-like, offset
Valves are elliptic and strongly arched about the apical axis. On the raphe valve, a curved hyaline area is present on either side of the axial area. Striae are fine, punctate and radiate. On the rapheless valve, the central sternum is narrowly lanceolate. The areolae are dash-like and offset from one another.