Karayevia ploenensis var. gessneri
-
Category
-
Length Range11-16 µm
-
Width Range4.8-5.6 µm
-
Striae in 10 µm14-16 in the center of raphe valve, 15-17 in the center of raphe valve, up to 20 at the ends
-
SynonymsAchnanthes ploenensis var. gessneri (Hust.) Lange-Bert. in Lange-Bert. and Krammer
-
ContributorMarina Potapova - May 2010
-
ReviewerRex Lowe - Nov 2011
Identification

Description
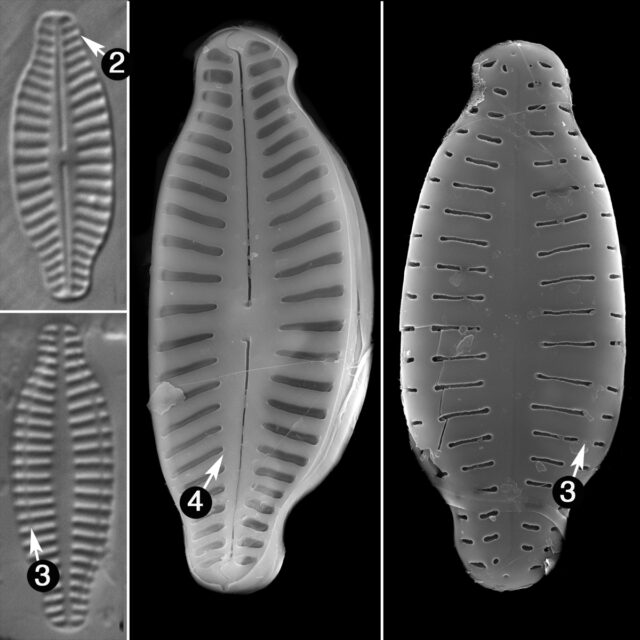
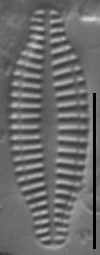
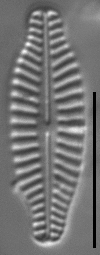
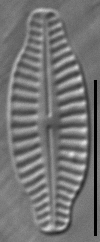
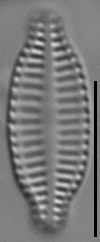
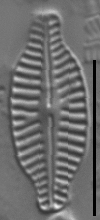
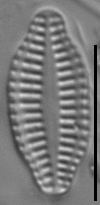
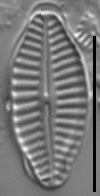
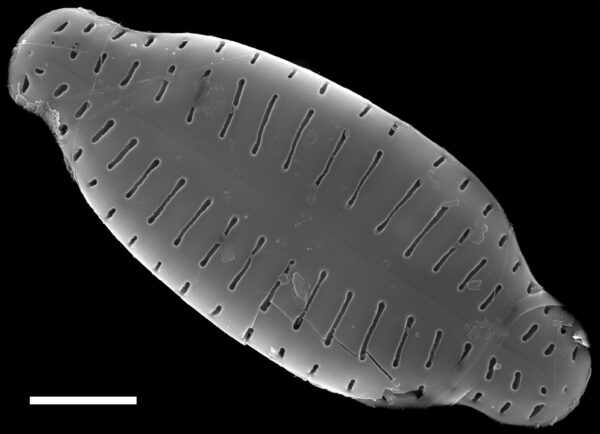
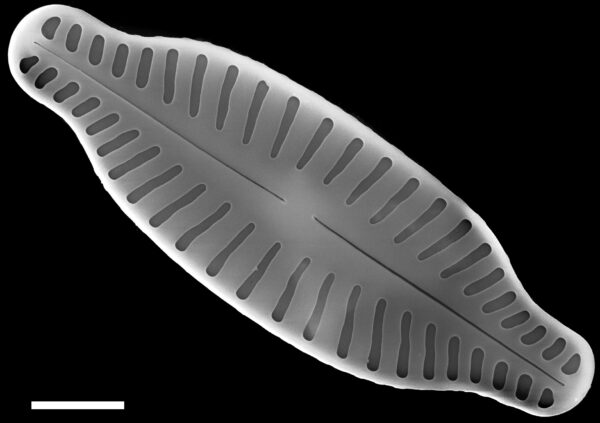
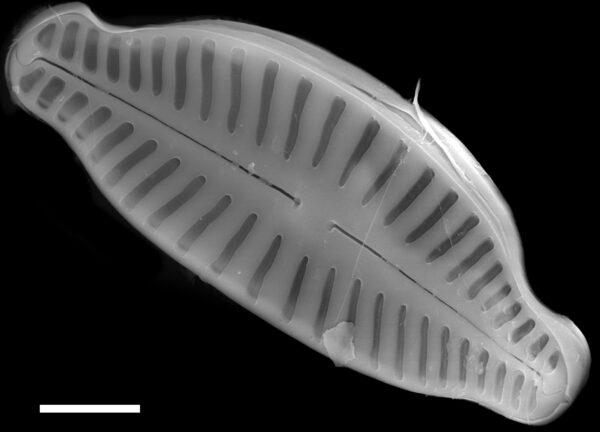
Valves are elliptic-lanceolate, with subrostrate to rostrate apices. Both raphe and rapheless valves have a narrow lanceolate axial area and lack a distinct central area. The raphe is straight. Striae on the raphe valve are strongly radiate, becoming parallel to slightly convergent toward the apices. The striae on the rapheless valve are slightly radiate, becoming parallel to slightly convergent toward the apices. The striae on the rapheless valve are interrupted by a marginal longitudinal line on each side of the valve.
Autecology
-
Size Range, µm3
-
Motility
-
Attachment
-
Habitat
-
Colony
-
Waterbody
-
Distribution
- Learn more about this
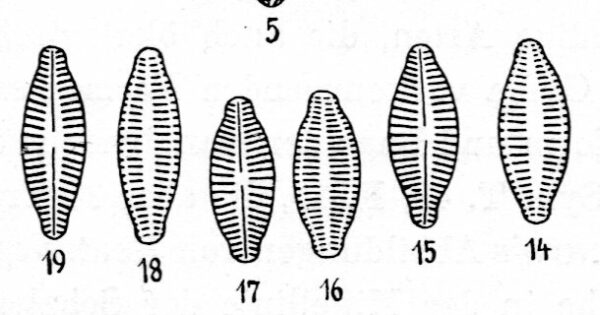
Original Description
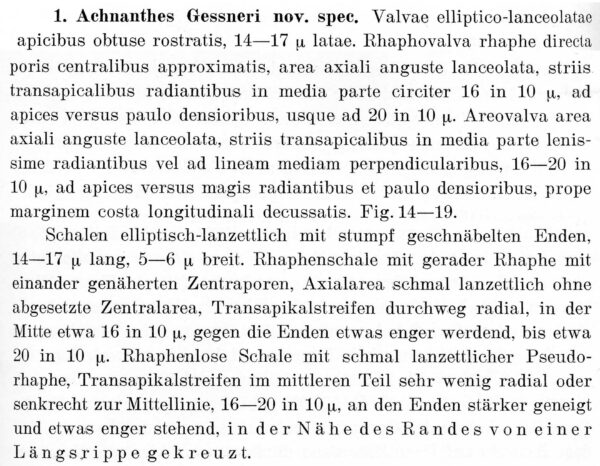
Valvae elliptico-lanceolatae apicibus obtuse rostratis, 14-17 µ latae. Rhaphovalva rhaphe directa poris centralibus approximatis, area axiali anguste lanceolata, striis transapicalibus radiantibus in media parte circiter 16 in 10 µ, ad apices versus paulo densioribus, usque ad 20 in 10 µ. Areovalva area axiali anguste lanceolata, striis transapicalibus in media parte lenissime radiantibus vel ad lineam mediam perpendicularibus, 16-20 in 10 µ, ad apices versus magis radiantibus et paulo densioribus, prope marginem costa longitudinali decussatis. Fig. 14-19.
-
BasionymAchnanthes gessneri
-
AuthorHust. 1953
-
Length Range14-17 µm
-
Width5-6 µm
-
Striae in 10µm16 in the center of raphe valve
Original Images
Citations & Links
Citations
Links
-
Index Nominum Algarum
-
GenBank
-
North American Diatom Ecological DatabaseNADED ID: 125008
-
Hustedt Collection
Cite This Page
Potapova, M. (2010). Karayevia ploenensis var. gessneri. In Diatoms of North America. Retrieved April 19, 2024, from https://diatoms.org/species/karayevia_ploenensis
Responses
The 15 response plots show an environmental variable (x axis) against the relative abundance (y axis) of Karayevia ploenensis var. gessneri from all the stream reaches where it was present. Note that the relative abundance scale is the same on each plot. Explanation of each environmental variable and units are as follows:
ELEVATION = stream reach elevation (meters)
STRAHLER = distribution plot of the Strahler Stream Order
SLOPE = stream reach gradient (degrees)
W1_HALL = an index that is a measure of streamside (riparian) human activity that ranges from 0 - 10, with a value of 0 indicating of minimal disturbance to a value of 10 indicating severe disturbance.
PHSTVL = pH measured in a sealed syringe sample (pH units)
log_COND = log concentration of specific conductivity (µS/cm)
log_PTL = log concentration of total phosphorus (µg/L)
log_NO3 = log concentration of nitrate (µeq/L)
log_DOC = log concentration of dissolved organic carbon (mg/L)
log_SIO2 = log concentration of silicon (mg/L)
log_NA = log concentration of sodium (µeq/L)
log_HCO3 = log concentration of the bicarbonate ion (µeq/L)
EMBED = percent of the stream substrate that is embedded by sand and fine sediment
log_TURBIDITY = log of turbidity, a measure of cloudiness of water, in nephelometric turbidity units (NTU).
DISTOT = an index of total human disturbance in the watershed that ranges from 1 - 100, with a value of 0 indicating of minimal disturbance to a value of 100 indicating severe disturbance.
Karayevia ploenensis var. gessneri
- Valves 4.8-5.6 µm wide
- Valve ends subrostrate to rostrate
- Rapheless valve with hyaline lines
- Axial area lanceolate
Valves are elliptic-lanceolate with subrostrate to rostrate apices. Both raphe and rapheless valves have a lanceolate axial area and lack a distinct central area. Striae in the center of raphe valve are strongly radiate. On the rapheless valve they are are slightly radiate. Only on rapheless valve the striae are interrupted by a...