Pseudostaurosira parasitica
-
Category
-
Length Range9-18 µm
-
Width Range4.5-5 µm
-
Striae in 10 µm19-21
-
SynonymsFragilaria parasitica (W.Sm.) Grunow in Van Heurck
Synedra parasitica (W.Sm.) Hust.
Synedrella parasitica (W.Sm.) Round in Maidana
-
ContributorEduardo A. Morales - Oct 2010
-
ReviewerSarah Spaulding - Aug 2013
Identification
Description
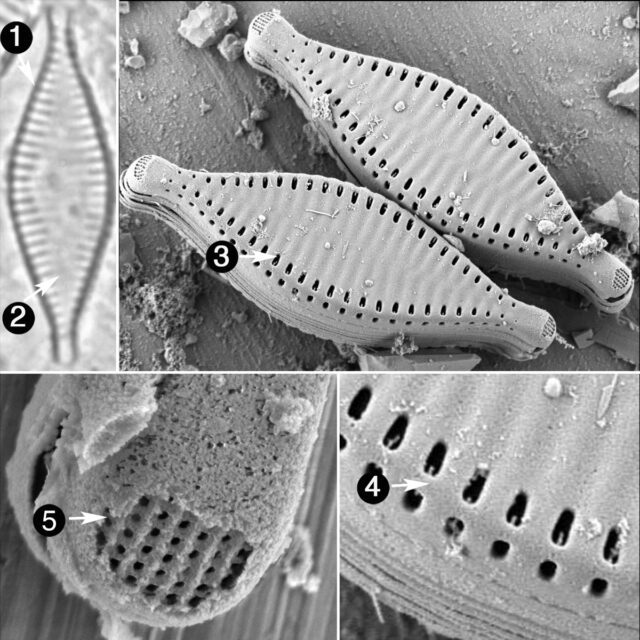
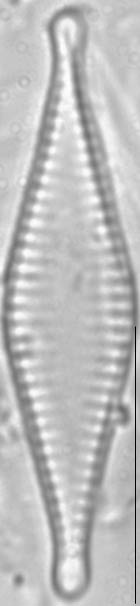
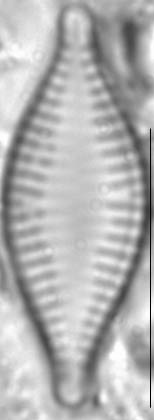
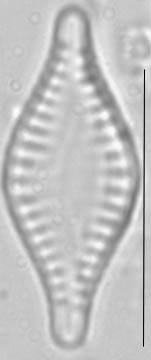
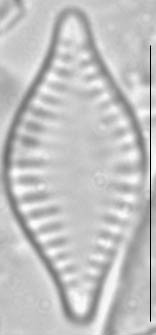
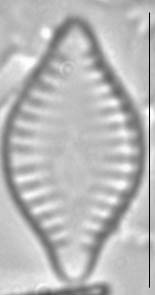
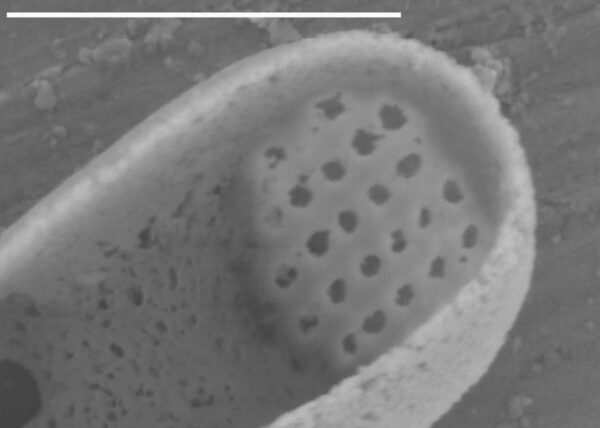
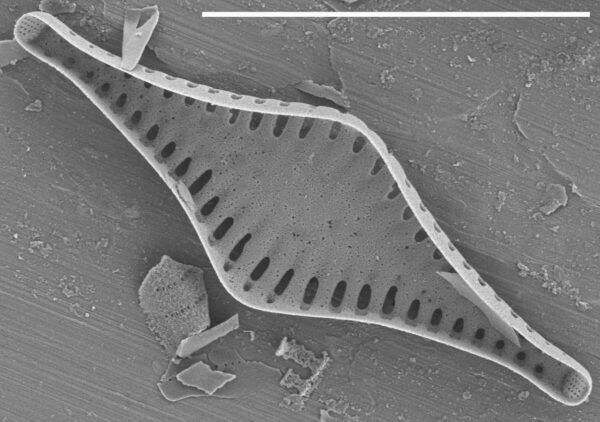
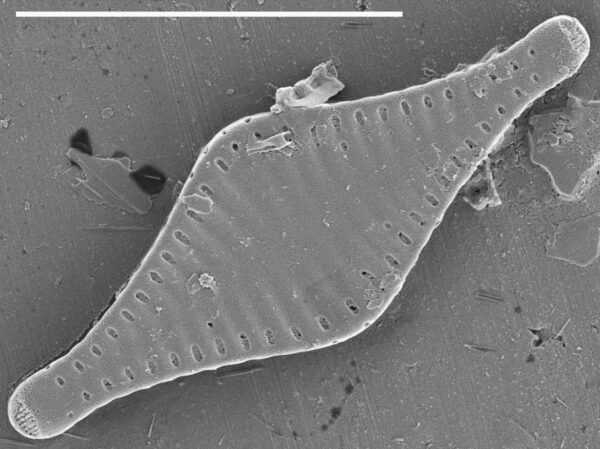
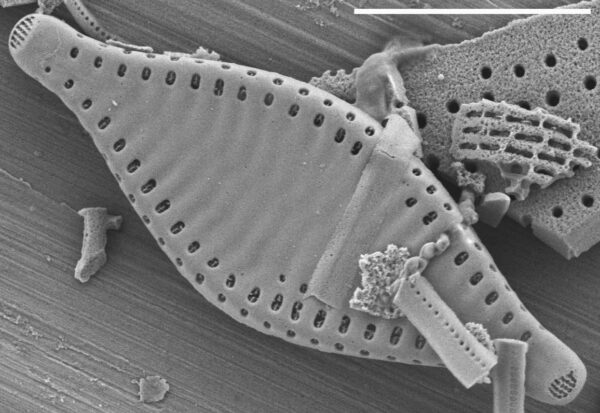
Valves are lanceolate, 4.5-5 µm wide by 9-18 µm long. Valves with subrostrate to subcapitate ends in larger specimens, cuneate in smaller specimens. Valve face flat or slightly undulate due to raised costae. The valve face/mantle junction forms a sharp angle. In girdle view, frustules are rectangular, solitary and often attached to other diatoms by a mucilage stalk. The axial area is widely lanceolate. Striae are distinct, composed of wide, round to oval areolae, 19-21 in 10 µm. Striae vary from parallel to radiate in the central area to slightly radiate toward the valve ends and extend onto the valve mantle. The costae are broad. Spines are absent. Well-developed apical pore fields with round poroids are present on the transition between valve face/mantle and are recessed into the valve ends.
Specimens from samples in the US sites show at least two morphological variants, often mixed in material from a single locality. One variant has slender, protracted and rostrate ends, while the other has wider more subcapitate ends.
Autecology
-
Size Range, µm3
-
Motility
-
Attachment
-
Habitat
-
Colony
-
BCG
-
Waterbody
-
Distribution
- Learn more about this
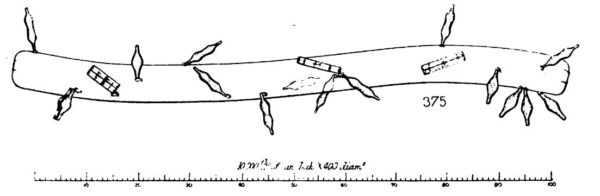
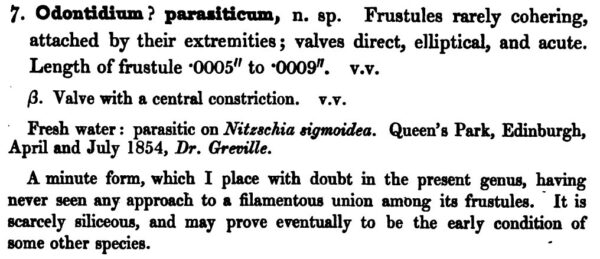
Original Description
Frustules rarely cohering, attached by their extremities; valves direct, elliptical, and acute. Length of frustule .0005" to .0009". v.v
-
BasionymOdontidium parasiticum
-
AuthorW.Sm. 1856
Original Images
Citations & Links
Citations
Links
-
Index Nominum Algarum
-
North American Diatom Ecological DatabaseNADED ID: 73010
Cite This Page
Morales, E. (2010). Pseudostaurosira parasitica. In Diatoms of North America. Retrieved April 23, 2024, from https://diatoms.org/species/pseudostaurosira_parasitica
Responses
The 15 response plots show an environmental variable (x axis) against the relative abundance (y axis) of Pseudostaurosira parasitica from all the stream reaches where it was present. Note that the relative abundance scale is the same on each plot. Explanation of each environmental variable and units are as follows:
ELEVATION = stream reach elevation (meters)
STRAHLER = distribution plot of the Strahler Stream Order
SLOPE = stream reach gradient (degrees)
W1_HALL = an index that is a measure of streamside (riparian) human activity that ranges from 0 - 10, with a value of 0 indicating of minimal disturbance to a value of 10 indicating severe disturbance.
PHSTVL = pH measured in a sealed syringe sample (pH units)
log_COND = log concentration of specific conductivity (µS/cm)
log_PTL = log concentration of total phosphorus (µg/L)
log_NO3 = log concentration of nitrate (µeq/L)
log_DOC = log concentration of dissolved organic carbon (mg/L)
log_SIO2 = log concentration of silicon (mg/L)
log_NA = log concentration of sodium (µeq/L)
log_HCO3 = log concentration of the bicarbonate ion (µeq/L)
EMBED = percent of the stream substrate that is embedded by sand and fine sediment
log_TURBIDITY = log of turbidity, a measure of cloudiness of water, in nephelometric turbidity units (NTU).
DISTOT = an index of total human disturbance in the watershed that ranges from 1 - 100, with a value of 0 indicating of minimal disturbance to a value of 100 indicating severe disturbance.
Pseudostaurosira parasitica
- Valves lanceolate
- Axial area broad and lanceolate
- Striae short
- Spines absent
- Apical pore fields recessed
Frustules are lanceolate with rostrate to subcapitate ends. Axial area broadly lanceolate. The striae are short, restricted to the valve margins. Apical pore fields are present at both apicies and are well developed. Under the SEM, the pore fields can be observed to be recessed below the valve surface.