Tabularia fasciculata
-
Category
-
Length Range34-100 µm
-
Width Range4.5-6.0 µm
-
Striae in 10 µm12-15
-
SynonymsFragilaria fasciculata (C.Agardh) Lange-Bert. 1980
Echinella fasciculata (C.Agardh) Jürg. 1816-1822
Ctenophora pulchella var. fasciculata (C.Agardh ex specim., Kütz.) Schönf. 1907
-
ContributorPat Kociolek - Mar 2011
-
ReviewerRex Lowe - Oct 2011
Identification
Description
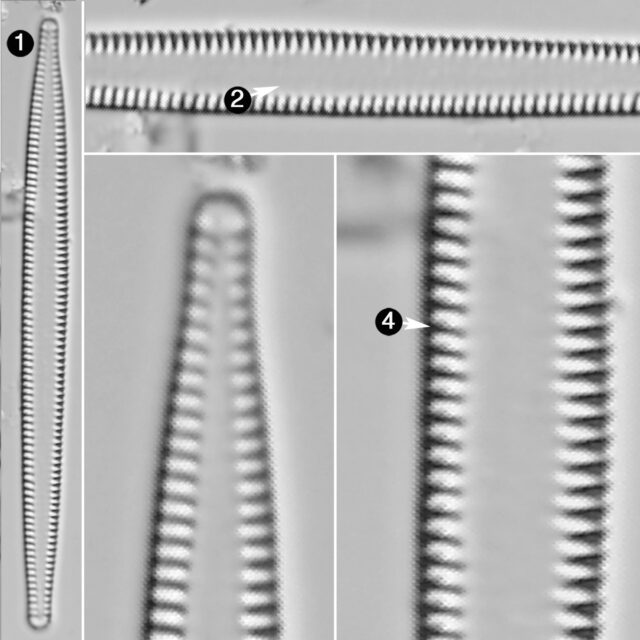
Valves are linear-lanceolate to lanceolate, with some specimens slightly or even distinctly asymmetric to the transapical axis, although this is not characteristic of the species. The apices are set off slightly and rounded but not capitate. The axial area is very broad and the width can be variable within populations. No central area is evident. The length:breadth ratio is also variable, even in this more restricted sense of the species (as compared to the interpretation of Krammer and Lange-Bertalot 1991). Striae are costate, areolae are not visible in the LM. Both apices appear to have small pore fields.
Patrick (in Patrick and Reimer 1966, p. 141) gives a detailed review of the nomenclature of this species.
Autecology
This taxon is characteristic of waters of high specific conductance and/or high salinity.
-
Size Range, µm3
-
Motility
-
Habitat
-
Occurrence
-
BCG
-
Waterbody
-
Distribution
- Learn more about this
Original Description
-
BasionymDiatoma fasciculata
-
AuthorC.Agardh 1812
Citations & Links
Citations
Links
-
Index Nominum Algarum
-
GenBank
-
North American Diatom Ecological DatabaseNADED ID: 200002
Cite This Page
Kociolek, P. (2011). Tabularia fasciculata. In Diatoms of North America. Retrieved April 25, 2024, from https://diatoms.org/species/tabularia_fasciculata
Responses
The 15 response plots show an environmental variable (x axis) against the relative abundance (y axis) of Tabularia fasciculata from all the stream reaches where it was present. Note that the relative abundance scale is the same on each plot. Explanation of each environmental variable and units are as follows:
ELEVATION = stream reach elevation (meters)
STRAHLER = distribution plot of the Strahler Stream Order
SLOPE = stream reach gradient (degrees)
W1_HALL = an index that is a measure of streamside (riparian) human activity that ranges from 0 - 10, with a value of 0 indicating of minimal disturbance to a value of 10 indicating severe disturbance.
PHSTVL = pH measured in a sealed syringe sample (pH units)
log_COND = log concentration of specific conductivity (µS/cm)
log_PTL = log concentration of total phosphorus (µg/L)
log_NO3 = log concentration of nitrate (µeq/L)
log_DOC = log concentration of dissolved organic carbon (mg/L)
log_SIO2 = log concentration of silicon (mg/L)
log_NA = log concentration of sodium (µeq/L)
log_HCO3 = log concentration of the bicarbonate ion (µeq/L)
EMBED = percent of the stream substrate that is embedded by sand and fine sediment
log_TURBIDITY = log of turbidity, a measure of cloudiness of water, in nephelometric turbidity units (NTU).
DISTOT = an index of total human disturbance in the watershed that ranges from 1 - 100, with a value of 0 indicating of minimal disturbance to a value of 100 indicating severe disturbance.

Tabularia fasciculata
- Valves linear-lanceolate to lanceolate
- Axial area very broad
- Distinct central area not evident
- Striae costate
Valves are linear-lanceolate to lanceolate. The apices are set off slightly, rounded but not capitate. The axial area is very broad. No central area is evident. Striae are costate.
 Diatoms of North America


