Plagiotropis lepidoptera var. proboscidea
-
Category
-
Length Range73-110 µm
-
Width Range17.1-20.4 µm
-
Striae in 10 µm17-19
-
Reported AsTropidoneis lepidoptera var. javanica (Hustedt 1938)
-
ContributorLoren Bahls - Feb 2012
-
ReviewerRex Lowe - Feb 2012
Identification
Description
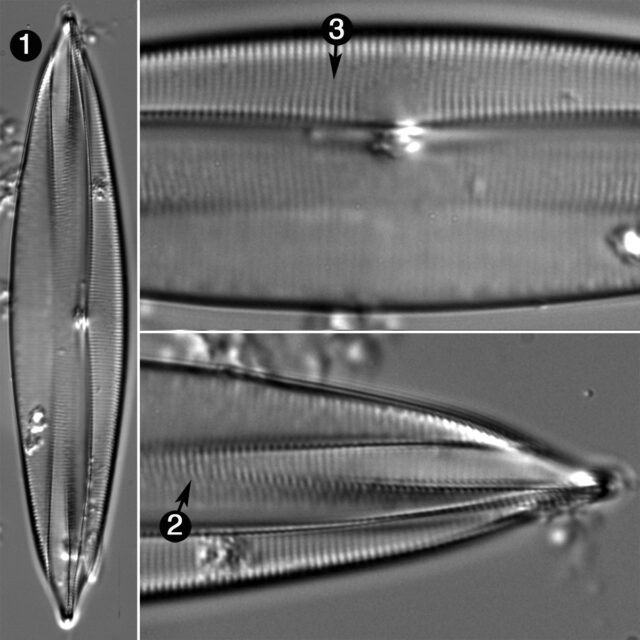
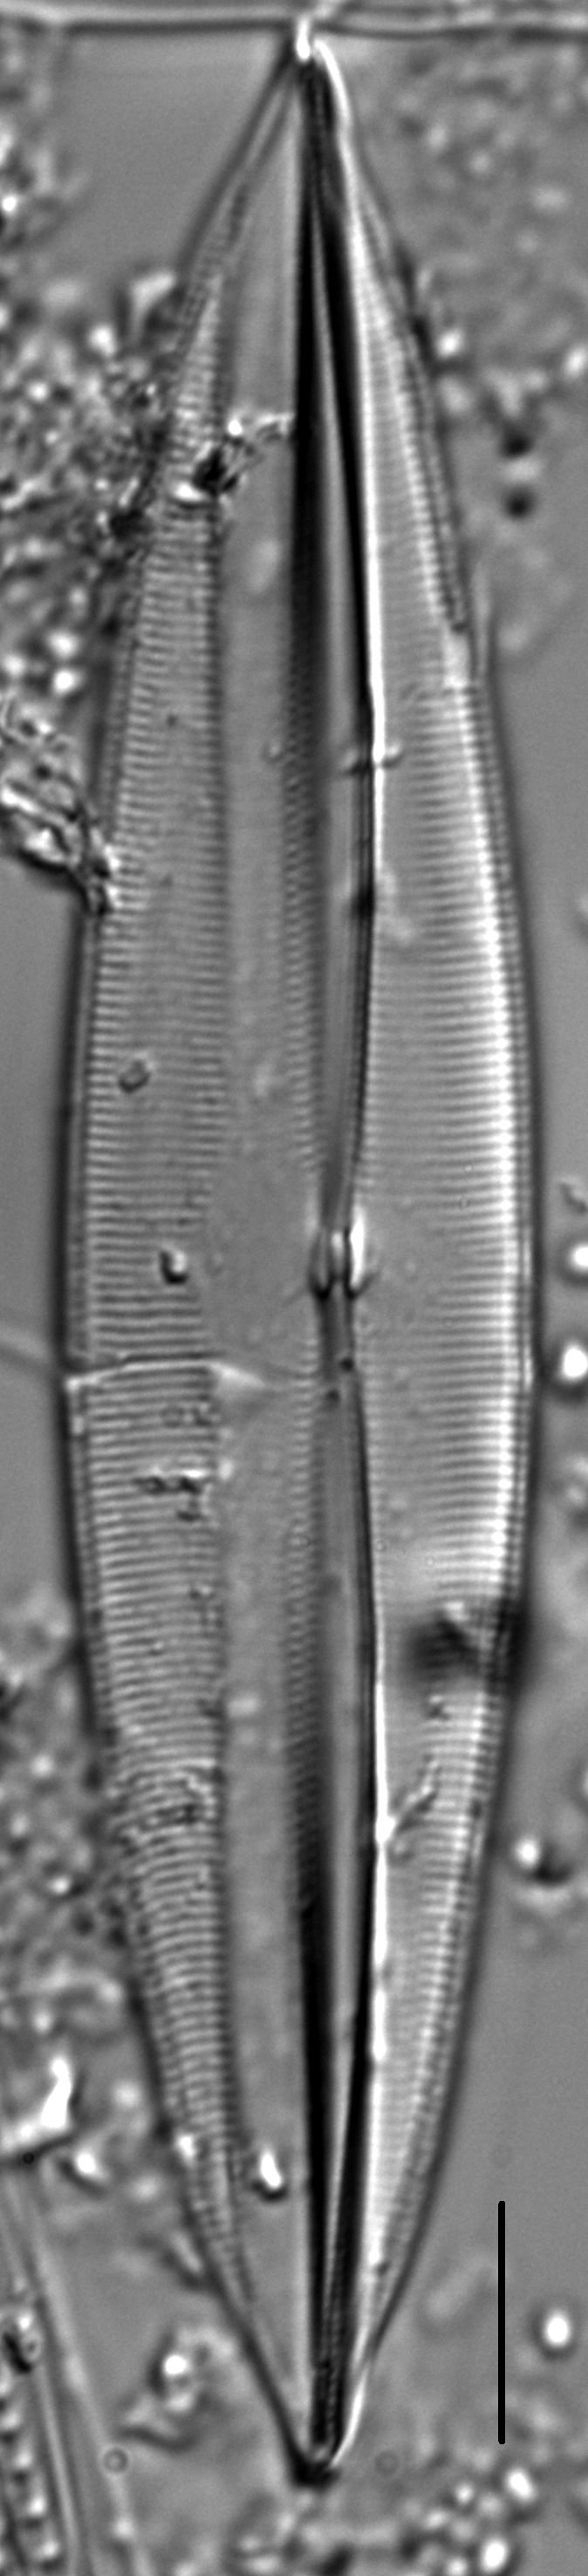
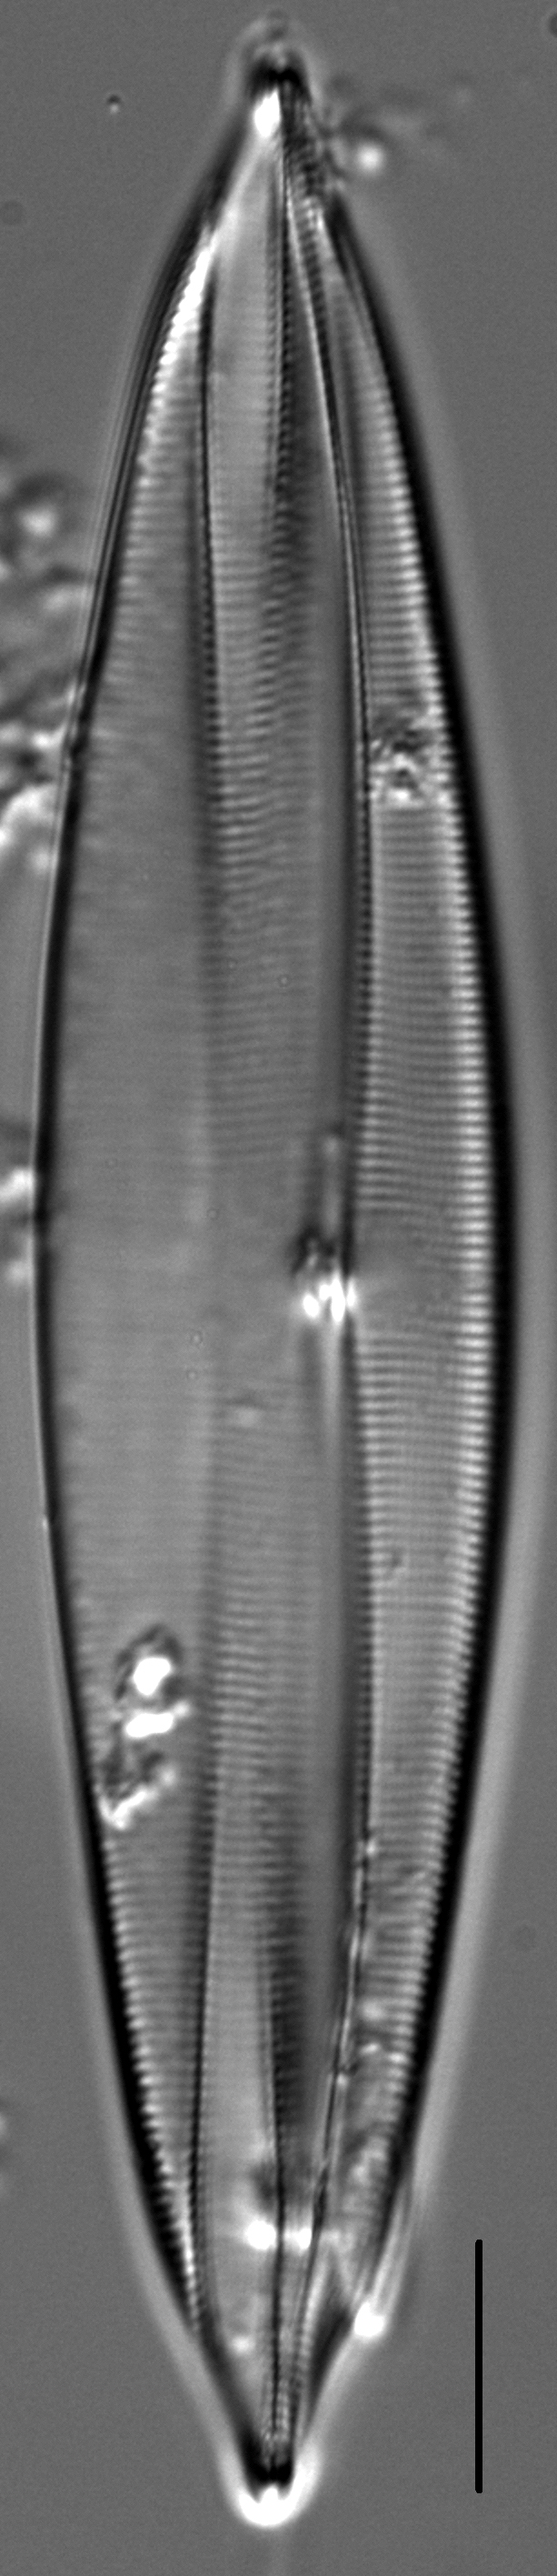
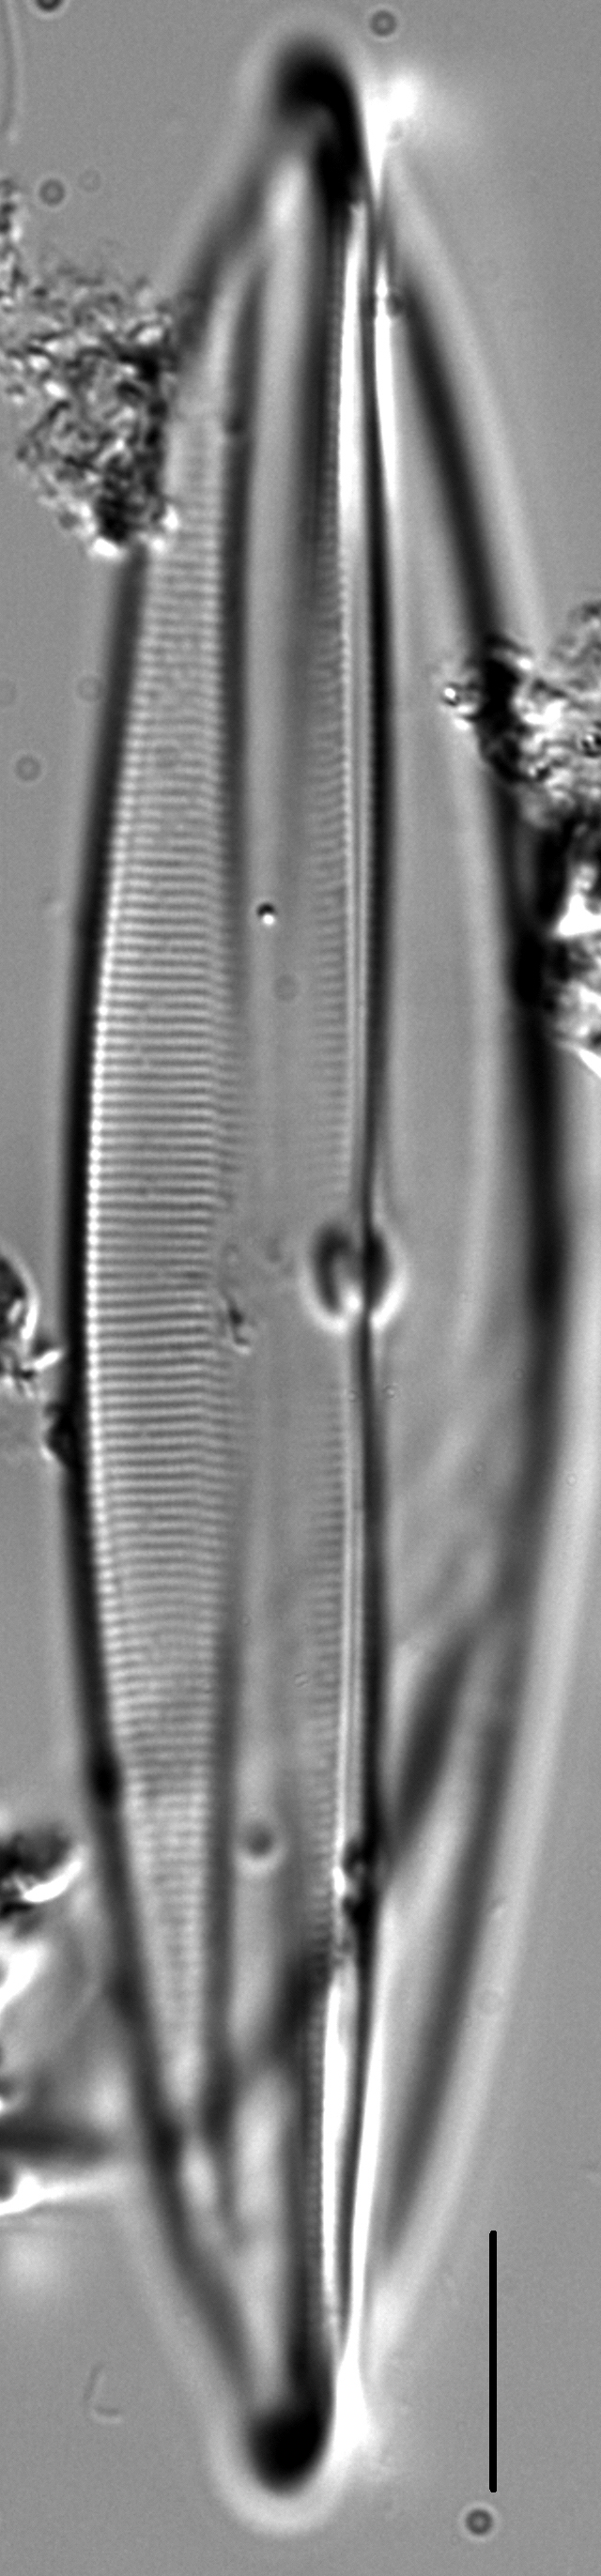
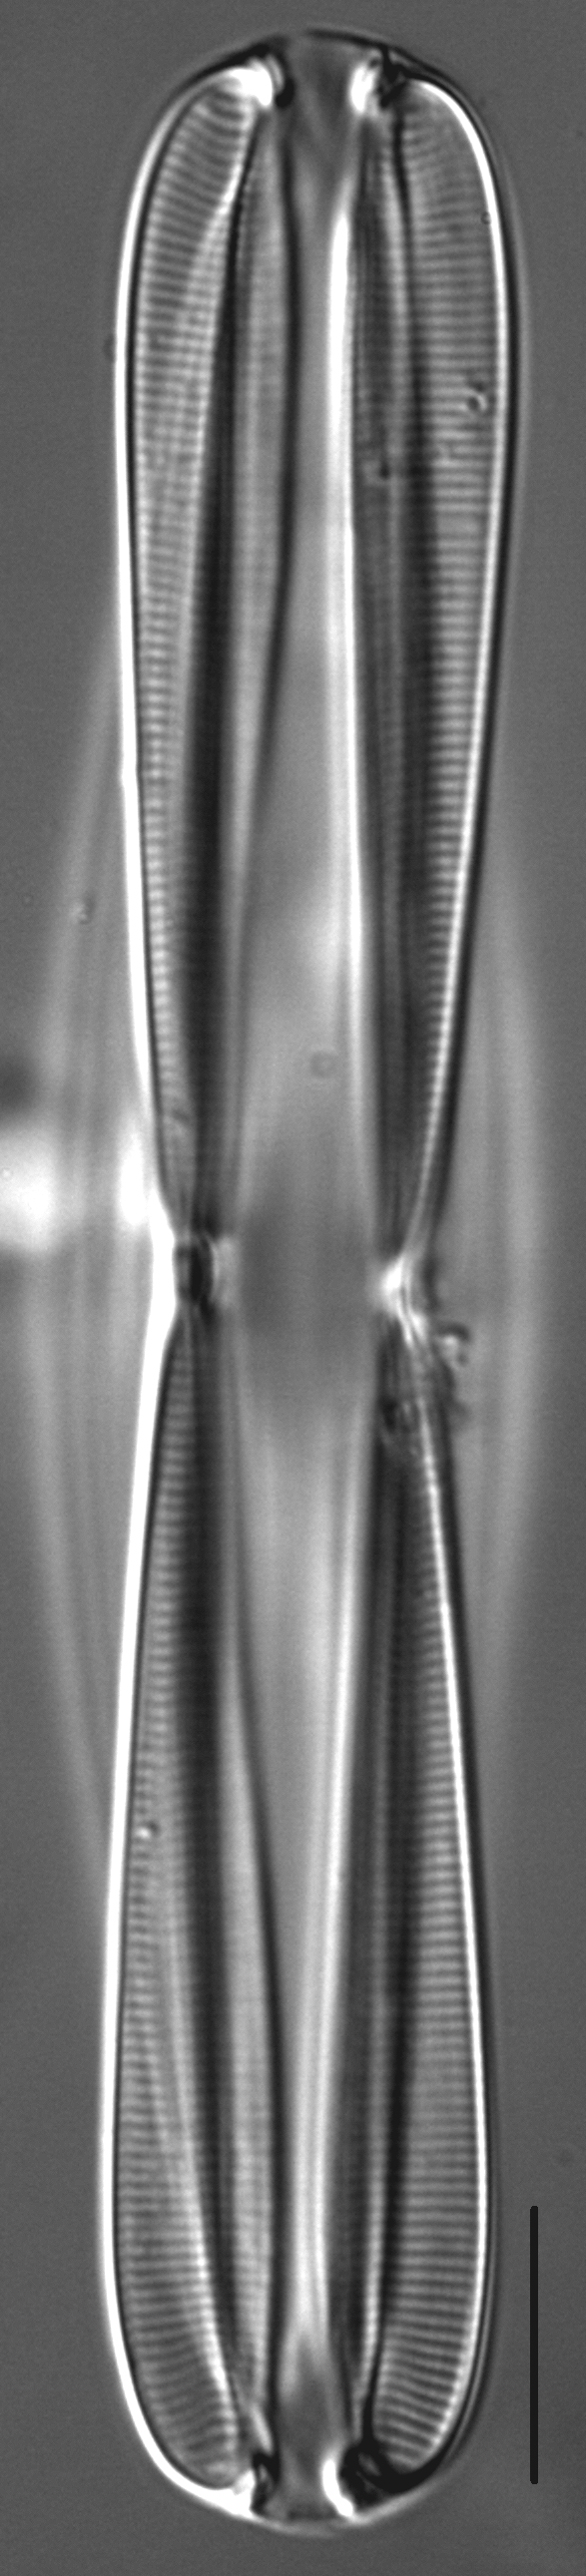
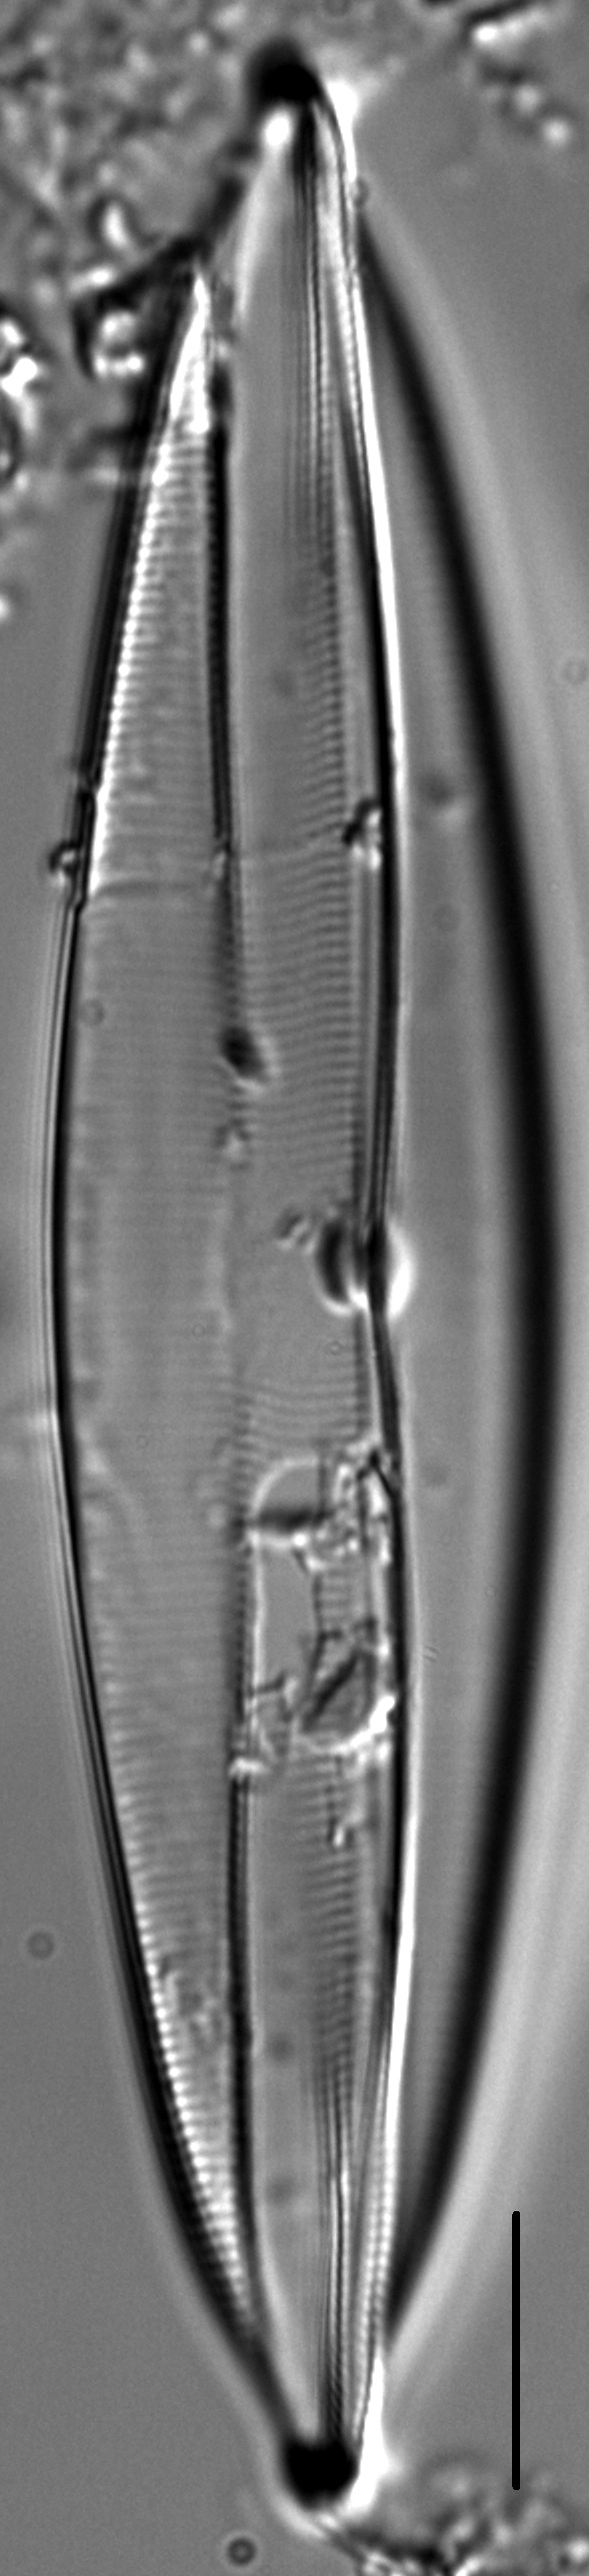
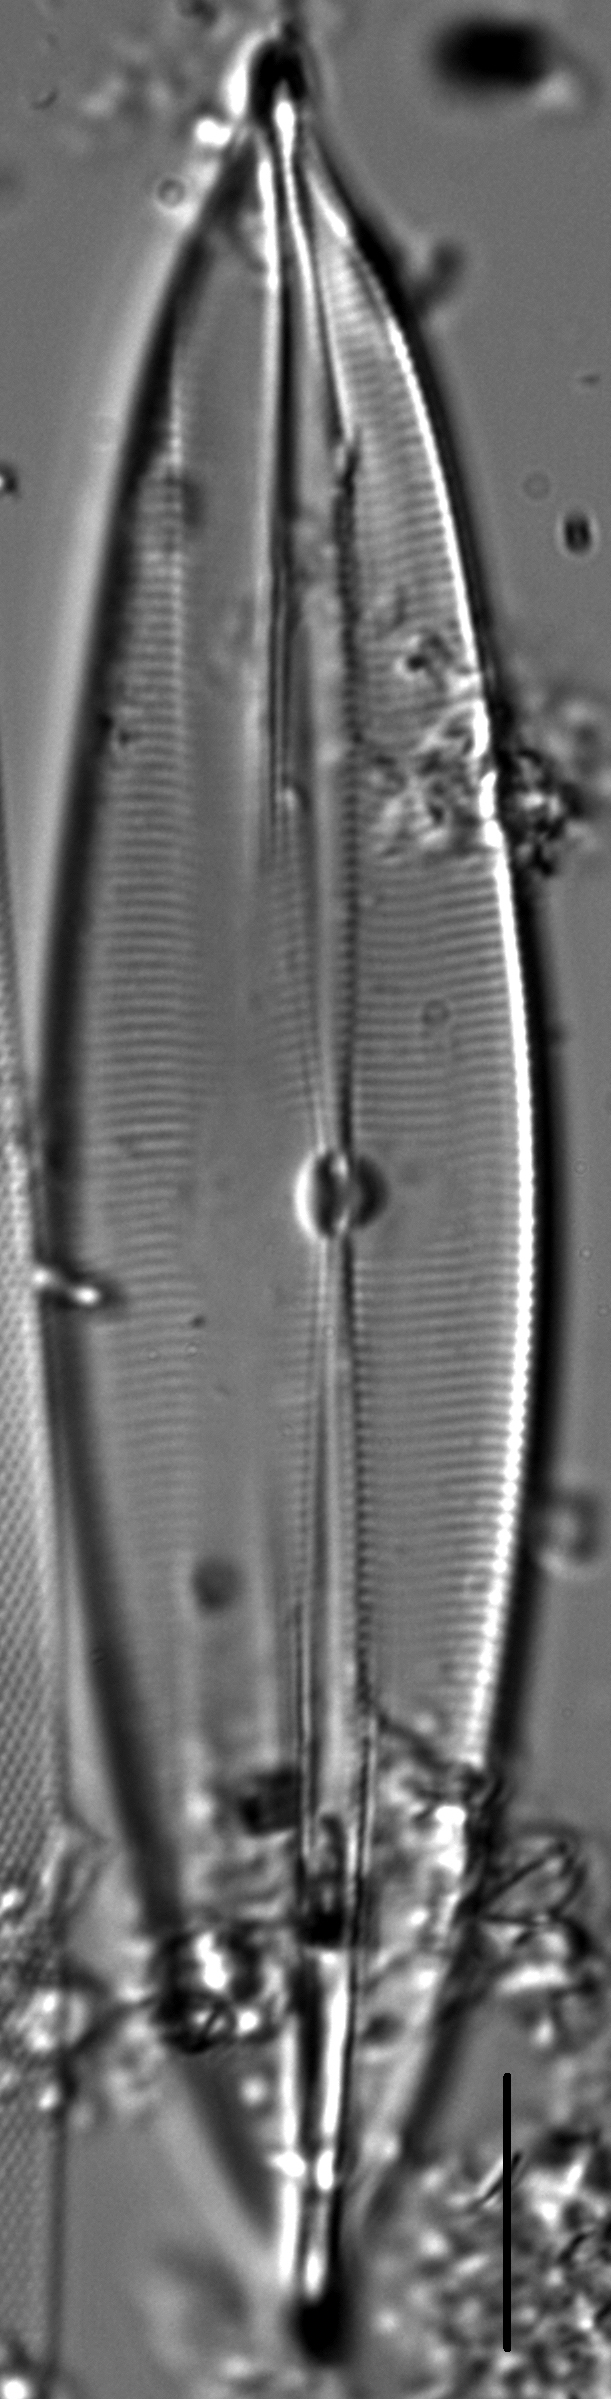
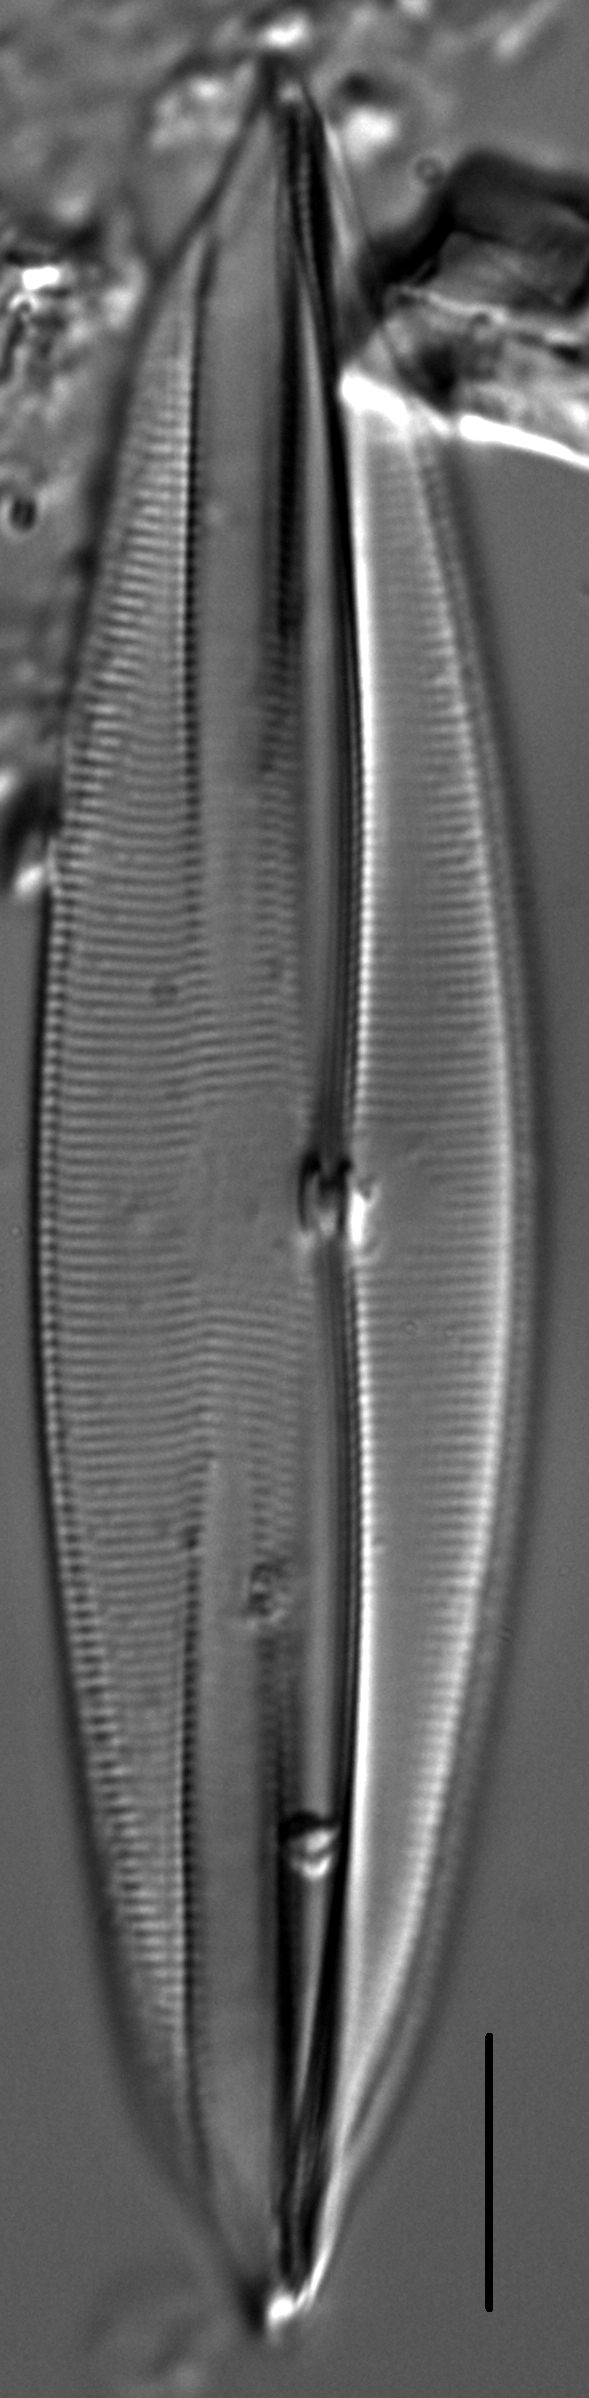
Valves are lanceolate with an arched valve face. The valve face has longitudinal folds and apiculate apices. The narrow axial area and raphe are positioned on the apex of a raised keel that runs along the apical axis. The central area is asymmetric and about one-half the width of the valve. The raphe is filiform with simple proximal and distal ends. Proximal raphe ends are straight and positioned close to one another. Striae are parallel at the center, becoming increasingly radiate towards the apices. The striae may appear wavy because of valve contours. Areolae are difficult to resolve in LM and number 26-30 in 10 µm.
Autecology
Plagiotropis lepidoptera var. proboscidea has been found in 37 samples collected from streams on the Northwestern Great Plains. The mean pH of these waters is 8.3 and the mean specific conductance is 4389 µS/cm. These waters have elevated concentrations of sodium (mean = 613 mg/L), sulfate (mean = 1307 mg/L), iron (mean = 1560 µg/L), and manganese (mean = 1944 µg/L). Common diatom associates include Navicula namibica, Planothidium engelbrechtii, Bacillaria paradoxa, Navicula peregrina, Staurophora brantii, Nitzschia siliqua, Entomoneis alata, and Tryblionella compressa. Patrick and Reimer (1975) report this taxon as widespread in the United States in alkaline streams. It was described from material collected in Cameroun, Africa (Cleve 1894).
-
Size Range, µm3
-
Motility
-
Attachment
-
Habitat
-
Colony
-
Waterbody
-
Distribution
- Learn more about this
Original Description
-
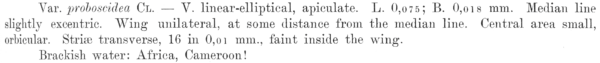
BasionymTropidoneis lepidoptera var. proboscidea
-
AuthorCleve 1894
-
Length Range75 µm
-
Width18 µm
-
Striae in 10µm16-18
Original Images
Citations & Links
Citations
Links
-
Index Nominum Algarum
-
North American Diatom Ecological DatabaseNADED ID: 53002
Cite This Page
Bahls, L. (2012). Plagiotropis lepidoptera var. proboscidea. In Diatoms of North America. Retrieved October 17, 2024, from https://diatoms.org/species/plagiotropis_lepidoptera_var._proboscidea
Responses
The 15 response plots show an environmental variable (x axis) against the relative abundance (y axis) of Plagiotropis lepidoptera var. proboscidea from all the stream reaches where it was present. Note that the relative abundance scale is the same on each plot. Explanation of each environmental variable and units are as follows:
ELEVATION = stream reach elevation (meters)
STRAHLER = distribution plot of the Strahler Stream Order
SLOPE = stream reach gradient (degrees)
W1_HALL = an index that is a measure of streamside (riparian) human activity that ranges from 0 - 10, with a value of 0 indicating of minimal disturbance to a value of 10 indicating severe disturbance.
PHSTVL = pH measured in a sealed syringe sample (pH units)
log_COND = log concentration of specific conductivity (µS/cm)
log_PTL = log concentration of total phosphorus (µg/L)
log_NO3 = log concentration of nitrate (µeq/L)
log_DOC = log concentration of dissolved organic carbon (mg/L)
log_SIO2 = log concentration of silicon (mg/L)
log_NA = log concentration of sodium (µeq/L)
log_HCO3 = log concentration of the bicarbonate ion (µeq/L)
EMBED = percent of the stream substrate that is embedded by sand and fine sediment
log_TURBIDITY = log of turbidity, a measure of cloudiness of water, in nephelometric turbidity units (NTU).
DISTOT = an index of total human disturbance in the watershed that ranges from 1 - 100, with a value of 0 indicating of minimal disturbance to a value of 100 indicating severe disturbance.
Plagiotropis lepidoptera var. proboscidea
- Valves medium
- Areolae very fine
- Striae parallel at valve center
Valves are lanceolate and less than 110 µm long. A prominent keel carrying the raphe runs along the apical axis. Striae are parallel in the middle, becoming radiate towards the apices. Areolae are very fine and number 26-30 in 10 µm.