Acanthoceras zachariasii

-
Category
-
Diameter11.9-23.0 µm
-
SynonymsAttheya zachariasii Brun
-
ContributorMark Edlund, David R.L. Burge - Jul 2017
-
ReviewerSarah Spaulding - Jul 2017
Identification

Description
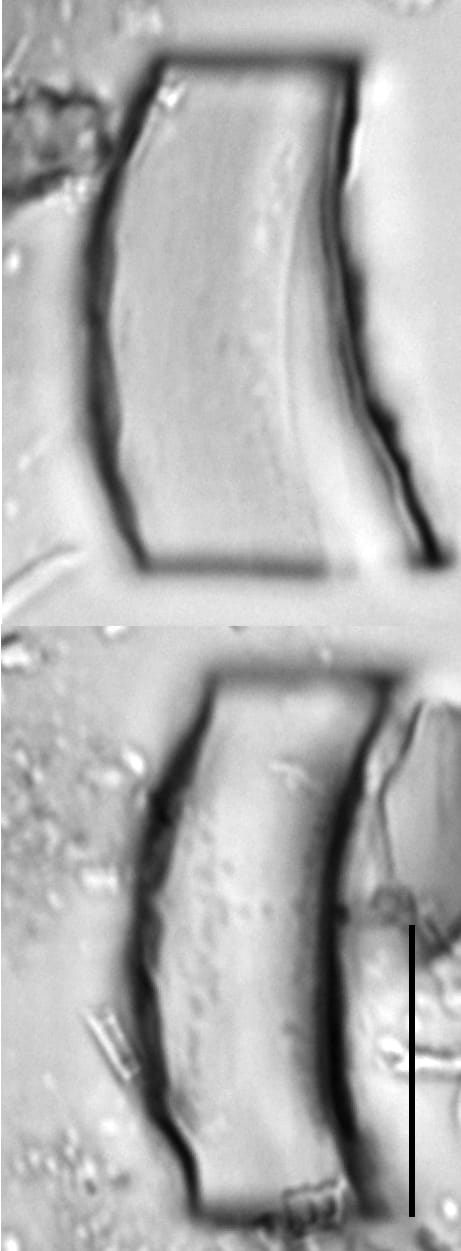
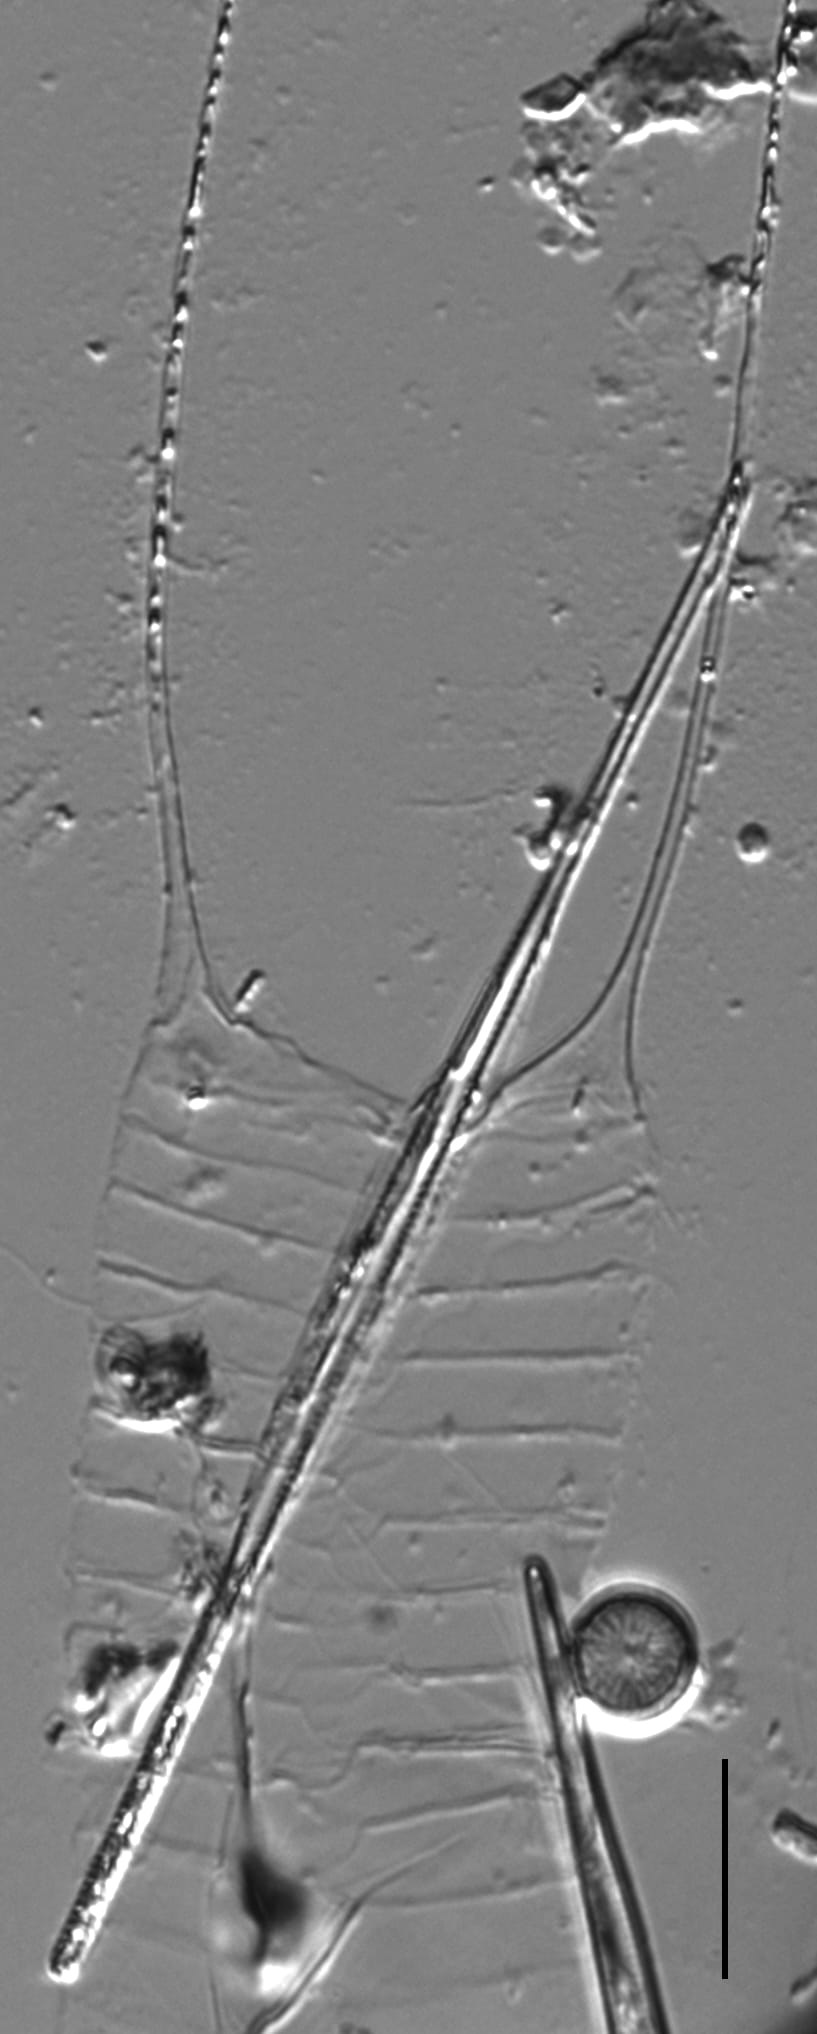
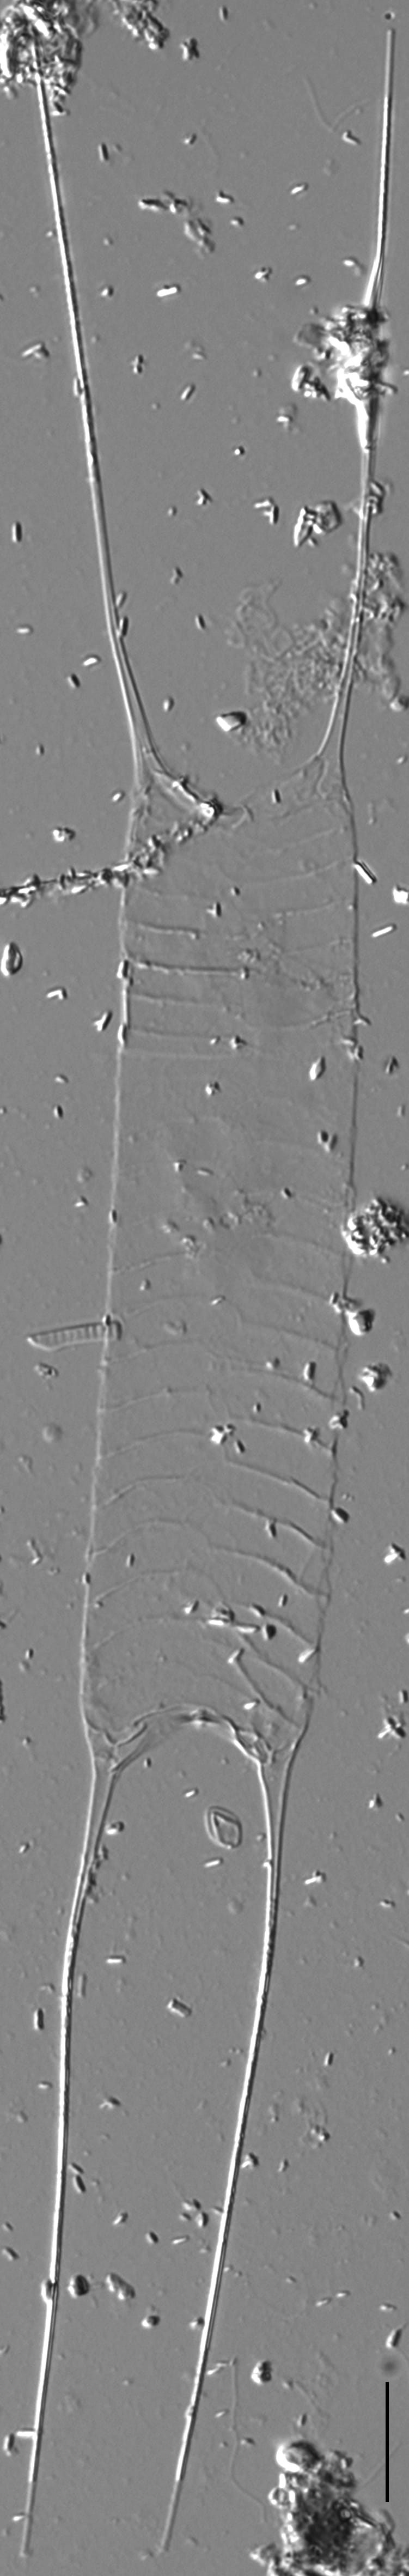
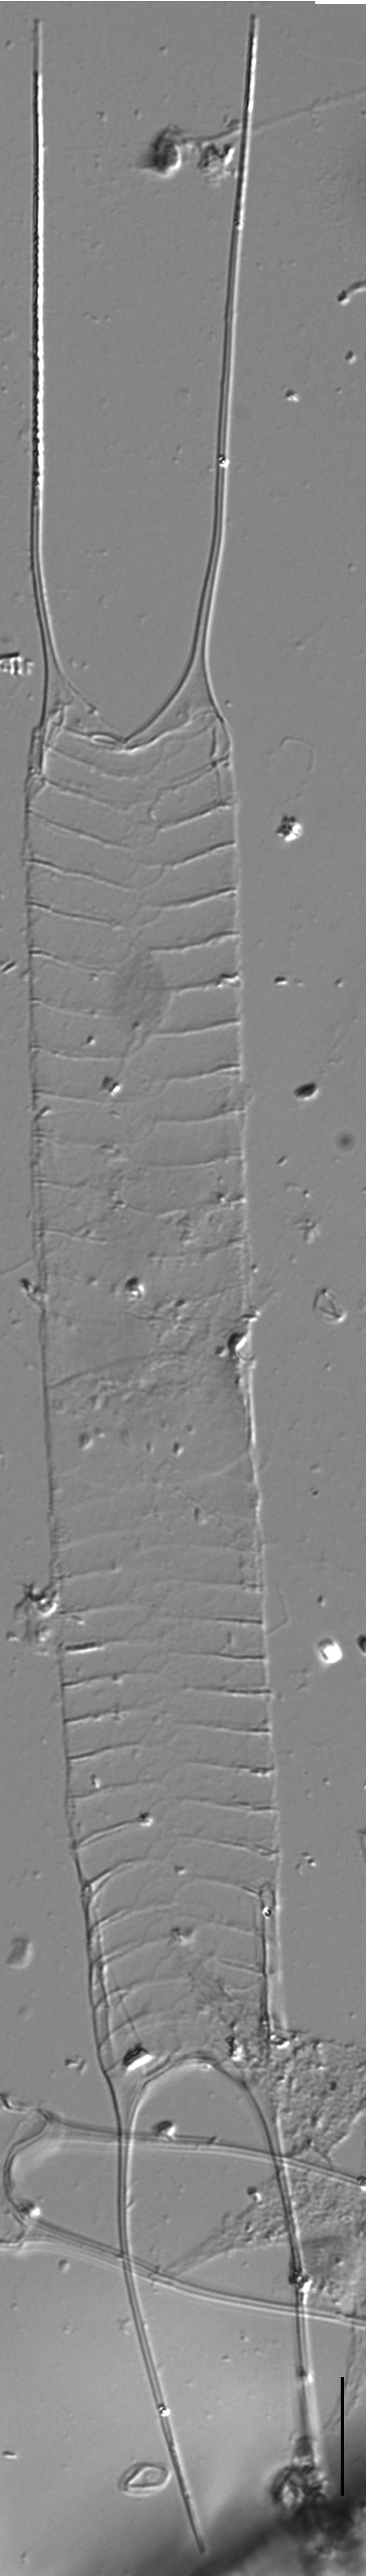
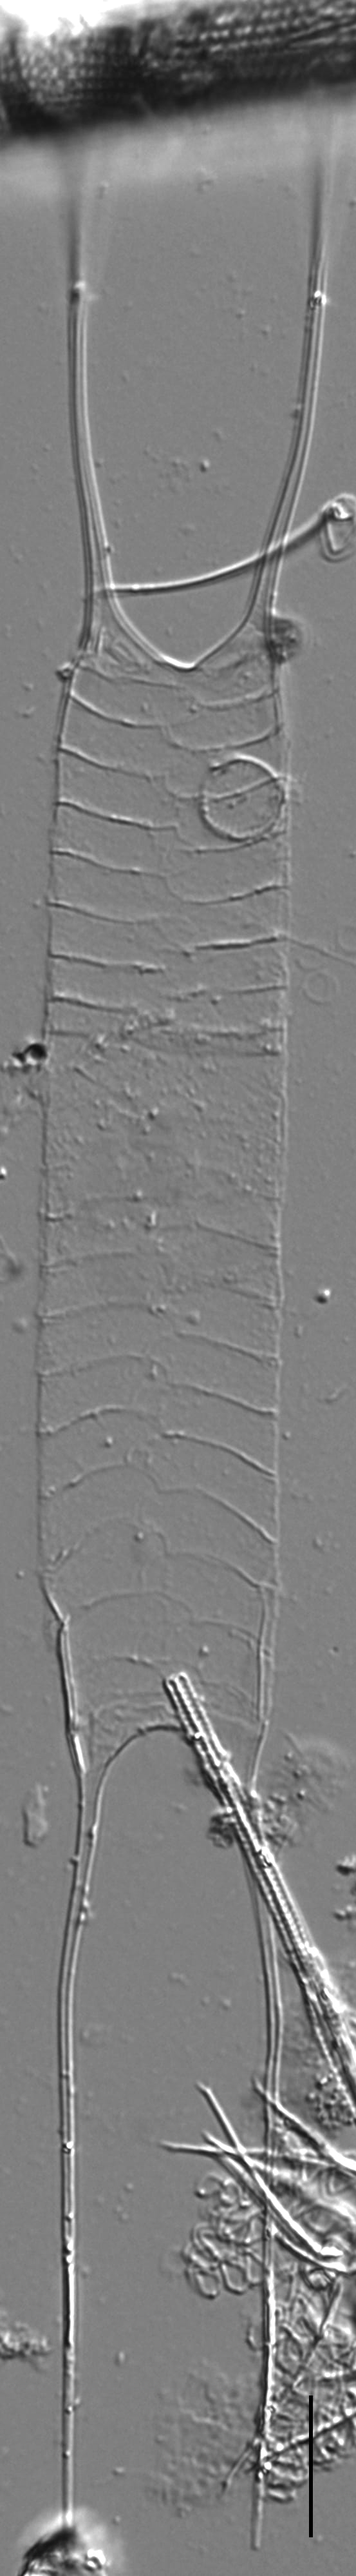
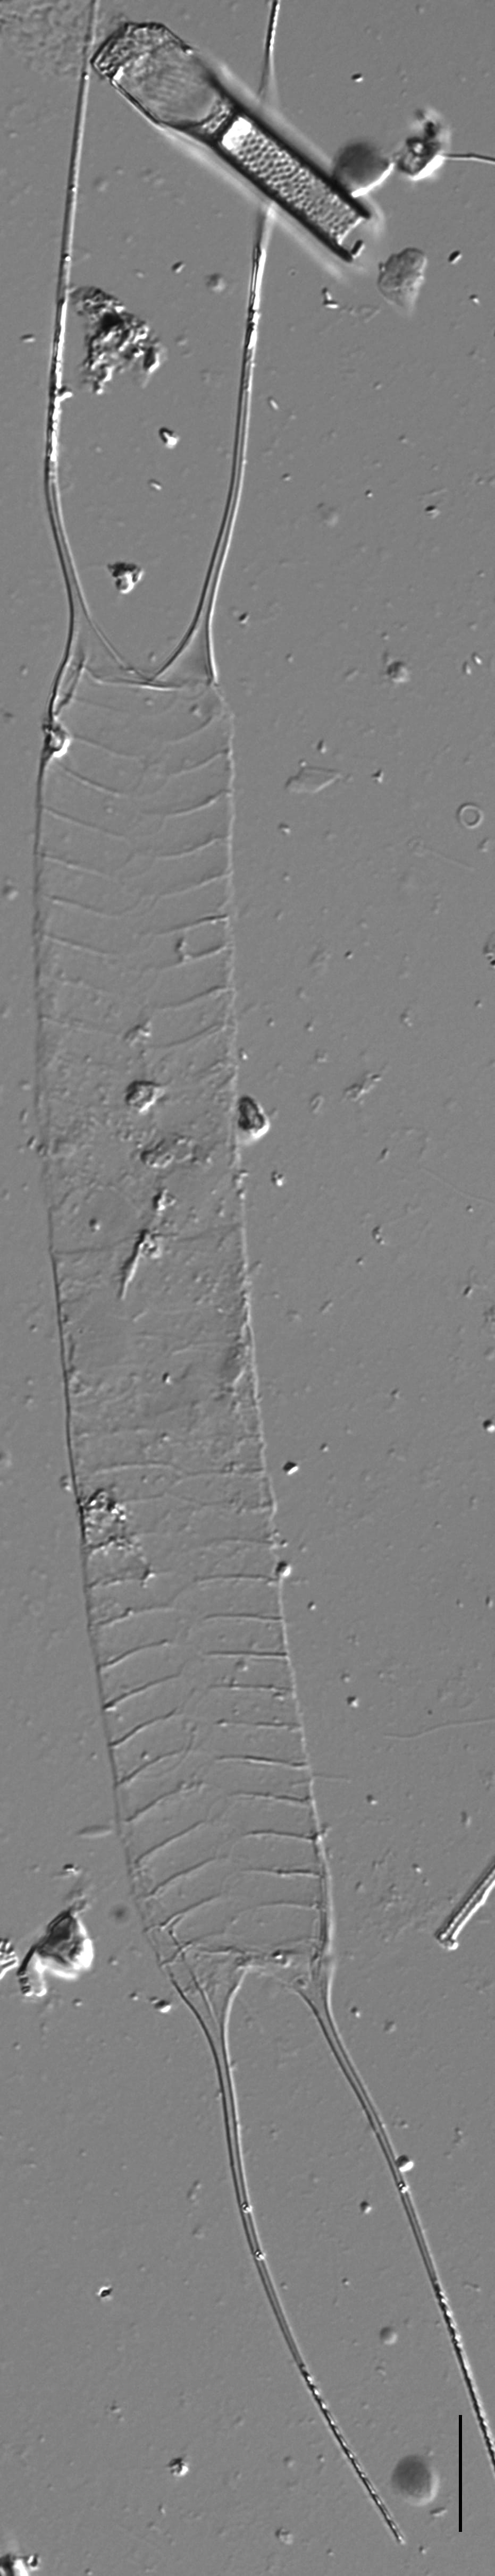
Frustules are lightly silicified and typically lie in girdle view. The pervalvar axis is long, 54-121 µm. Valves have bipolar symmetry and are characterized by two long, horn-like extensions (55-65 µm) on each valve. The girdle bands are open, with each end aligned to form a zig-zag suture. The girdle band density is 2.4-3.3 in 10 µm. Cells produce heavily silicified endogenous resting spores, which may be present within frustules. More often, the resting spores are detected in lake sediment deposits. Resting spores range in length from 14.3-41.0 µm and 5.2-11.5 µm in pervalvar axis. They have a scalloped and convex primary valve and a smooth concave secondary valve (Edlund and Stoermer 1993). Because frustules are so lightly silicified, they are often destroyed by typical processing methods. Cells are best observed by making "burn mounts".
Autecology
Acanthoceras zachariasii is a planktonic, ephemeral species of temperate, eutrophic and moderately alkaline lakes and large rivers (Edlund and Stoermer 1993). It is probably more widely distributed, but it is easily destroyed by processing if harsh preparation techniques are used. The specimens shown here are from a shallow, nutrient-rich habitat (Lazy Lagoon) on West Lake Okoboji, Iowa. It has also been collected in other lakes in the Iowa Great Lakes region, including Spirit Lake and East Lake Okoboji.
-
Size Range, µm3
-
Motility
-
Attachment
-
Habitat
-
Colony
-
Waterbody
- Learn more about this
Original Description
-
BasionymAttheya zachariasii
-
AuthorBrun 1894
-
Length Range15-20 µm
Original Images


Citations & Links
Citations
Cite This Page
Edlund, M., Burge, D. (2017). Acanthoceras zachariasii. In Diatoms of North America. Retrieved May 02, 2026, from https://diatoms.org/species/52446/acanthoceras_zachariasii
Responses
The 15 response plots show an environmental variable (x axis) against the relative abundance (y axis) of Acanthoceras zachariasii from all the stream reaches where it was present. Note that the relative abundance scale is the same on each plot. Explanation of each environmental variable and units are as follows:
ELEVATION = stream reach elevation (meters)
STRAHLER = distribution plot of the Strahler Stream Order
SLOPE = stream reach gradient (degrees)
W1_HALL = an index that is a measure of streamside (riparian) human activity that ranges from 0 - 10, with a value of 0 indicating of minimal disturbance to a value of 10 indicating severe disturbance.
PHSTVL = pH measured in a sealed syringe sample (pH units)
log_COND = log concentration of specific conductivity (µS/cm)
log_PTL = log concentration of total phosphorus (µg/L)
log_NO3 = log concentration of nitrate (µeq/L)
log_DOC = log concentration of dissolved organic carbon (mg/L)
log_SIO2 = log concentration of silicon (mg/L)
log_NA = log concentration of sodium (µeq/L)
log_HCO3 = log concentration of the bicarbonate ion (µeq/L)
EMBED = percent of the stream substrate that is embedded by sand and fine sediment
log_TURBIDITY = log of turbidity, a measure of cloudiness of water, in nephelometric turbidity units (NTU).
DISTOT = an index of total human disturbance in the watershed that ranges from 1 - 100, with a value of 0 indicating of minimal disturbance to a value of 100 indicating severe disturbance.
Acanthoceras zachariasii
- Frustules lightly silicified
- Valves with long extensions
- Girdle bands numerous
- Resting spores distinct
Frustules are lightly silicified and typically lie in girdle view. Valves have two long horn-like extensions. Girdle bands are numerous. Resting spores are distinct, and resistant to processing, while the delicate frustules are easily destroyed.