
Credit: Loren Bahls
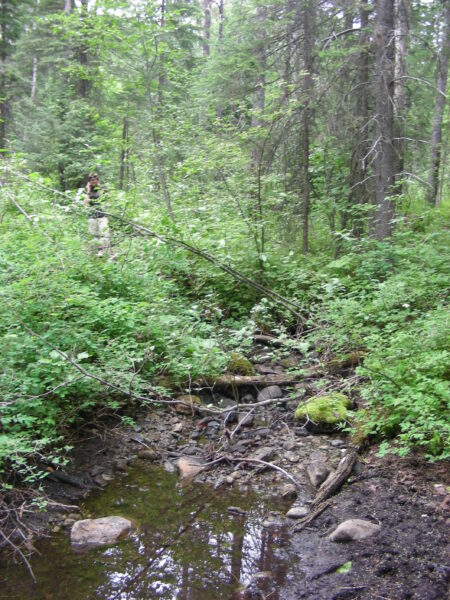
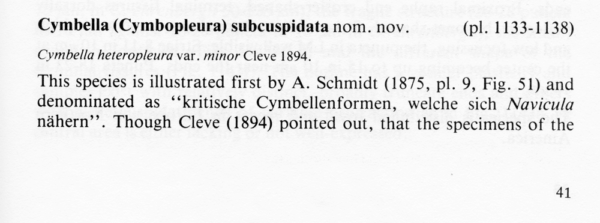
Upper Two Medicine Lake, Glacier National Park, Montana: home of Cymbopleura subcuspidata.
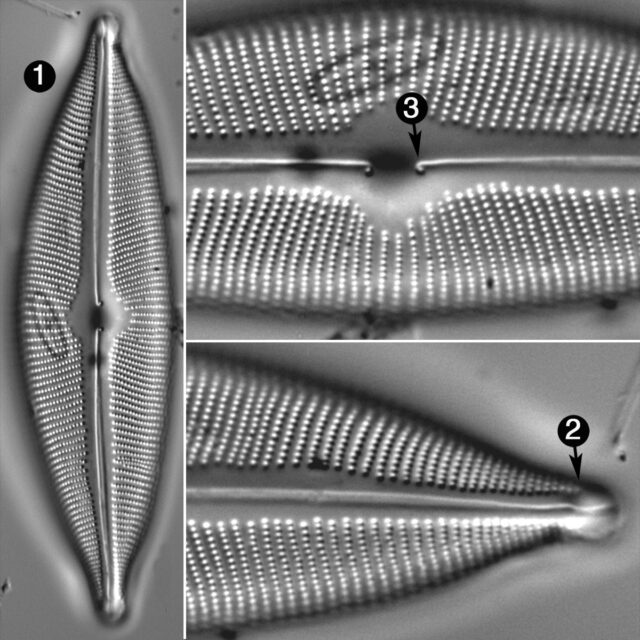
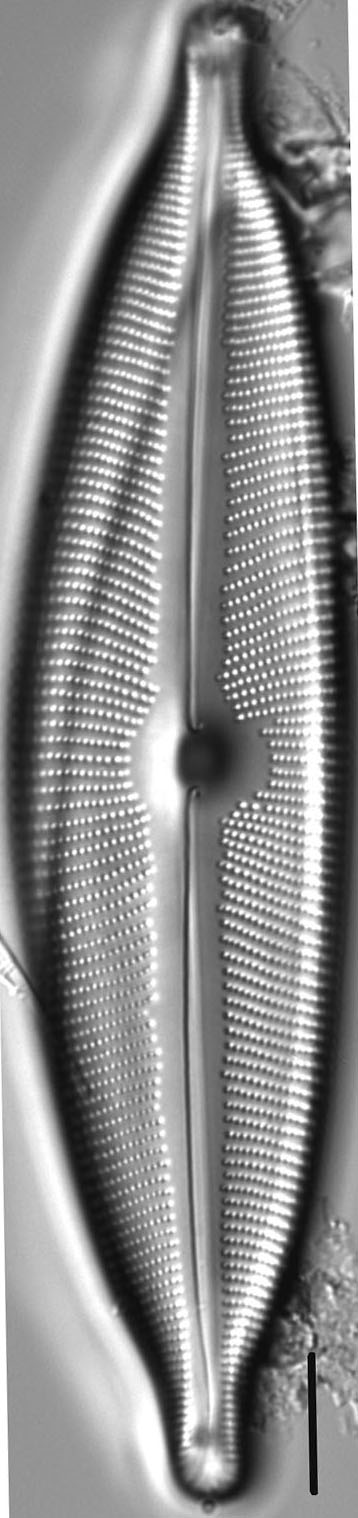
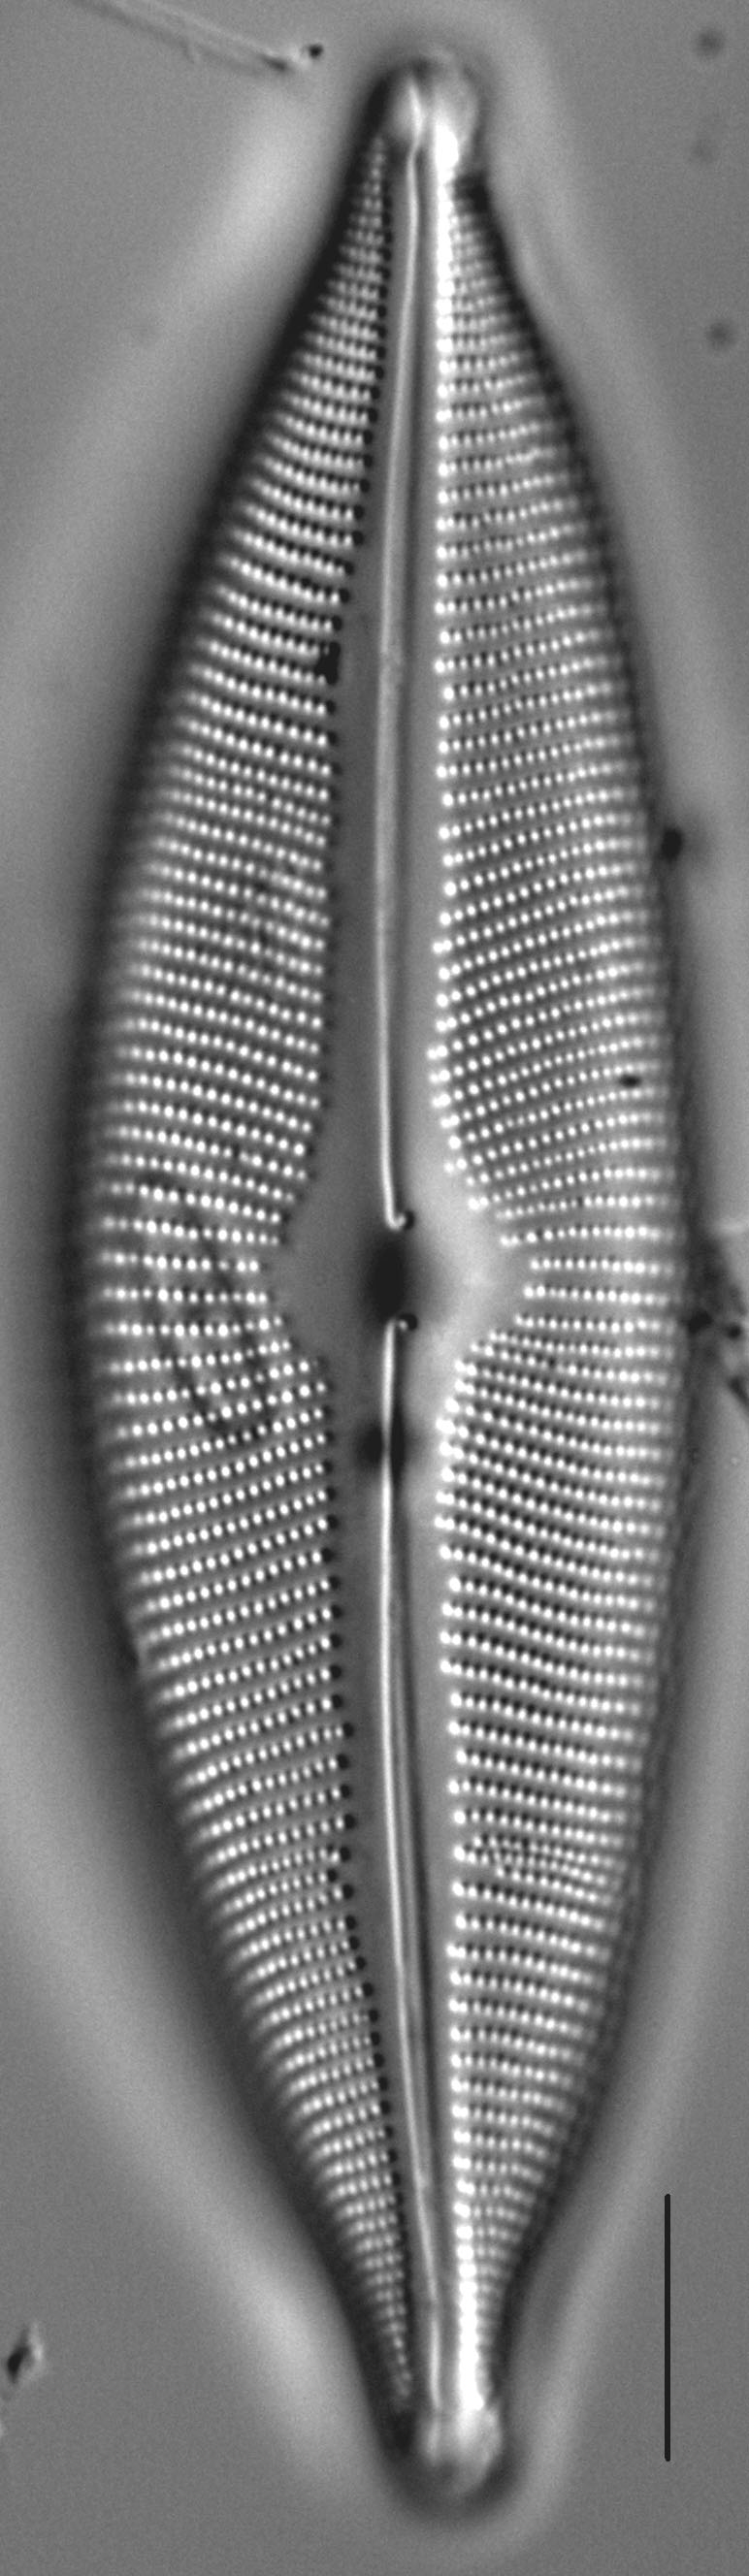
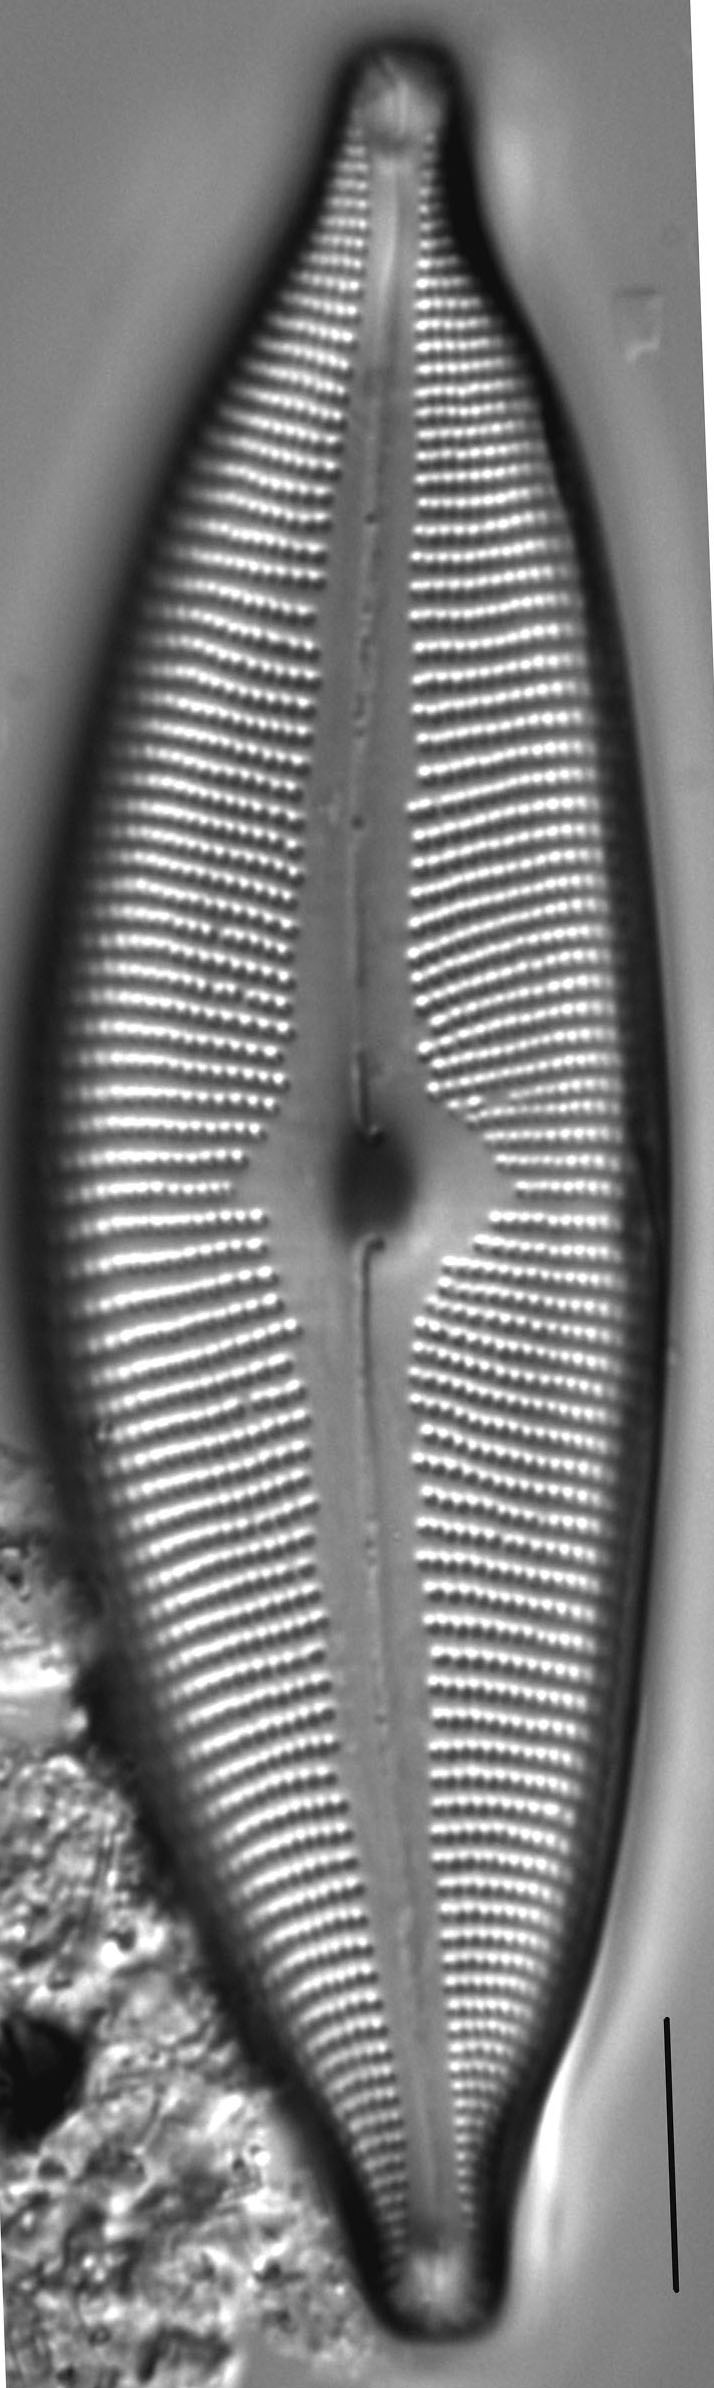
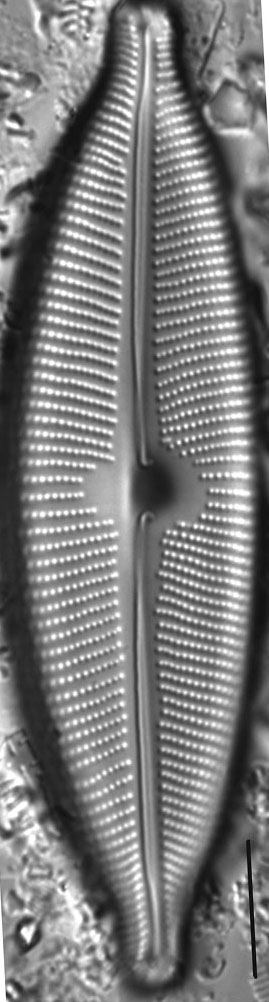
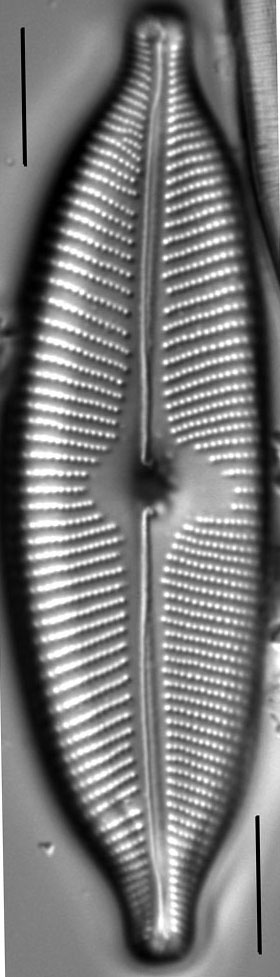
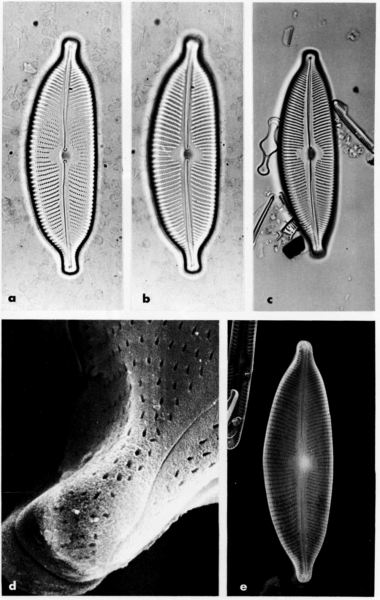
Valves are elliptic-lanceolate and slightly dorsiventral with almost equally arched dorsal and ventral margins that taper towards bluntly rounded rostrate to subcapitate apices. The length to width ratio is 3.3-4.4. The moderately narrow axial area widens gradually from the apices towards a large rounded and asymmetric central area. The raphe is lateral and narrows towards the distal and proximal ends. Proximal raphe ends are deflected ventrally and shaped like a crochet hook or a crosier. Terminal raphe fissures are deflected dorsally. Striae are radiate throughout and more closely spaced towards the apices. Areolae are easily resolved in LM and number 19-22 in 10 µm.
Cymbopleura subcuspidata occurs frequently in lakes and ponds in the northern Rocky Mountains. Concurrent measurements of pH in waters where C. subcuspidata has been collected range from 6.73 to 7.78. Specific conductance in these waters ranges from 22 to 53 µS/cm.
Bahls, L. (2012). Cymbopleura subcuspidata. In Diatoms of North America. Retrieved November 21, 2024, from https://diatoms.org/species/cymbopleura_subcuspidata
The 15 response plots show an environmental variable (x axis) against the relative abundance (y axis) of Cymbopleura subcuspidata from all the stream reaches where it was present. Note that the relative abundance scale is the same on each plot. Explanation of each environmental variable and units are as follows:
ELEVATION = stream reach elevation (meters)
STRAHLER = distribution plot of the Strahler Stream Order
SLOPE = stream reach gradient (degrees)
W1_HALL = an index that is a measure of streamside (riparian) human activity that ranges from 0 - 10, with a value of 0 indicating of minimal disturbance to a value of 10 indicating severe disturbance.
PHSTVL = pH measured in a sealed syringe sample (pH units)
log_COND = log concentration of specific conductivity (µS/cm)
log_PTL = log concentration of total phosphorus (µg/L)
log_NO3 = log concentration of nitrate (µeq/L)
log_DOC = log concentration of dissolved organic carbon (mg/L)
log_SIO2 = log concentration of silicon (mg/L)
log_NA = log concentration of sodium (µeq/L)
log_HCO3 = log concentration of the bicarbonate ion (µeq/L)
EMBED = percent of the stream substrate that is embedded by sand and fine sediment
log_TURBIDITY = log of turbidity, a measure of cloudiness of water, in nephelometric turbidity units (NTU).
DISTOT = an index of total human disturbance in the watershed that ranges from 1 - 100, with a value of 0 indicating of minimal disturbance to a value of 100 indicating severe disturbance.