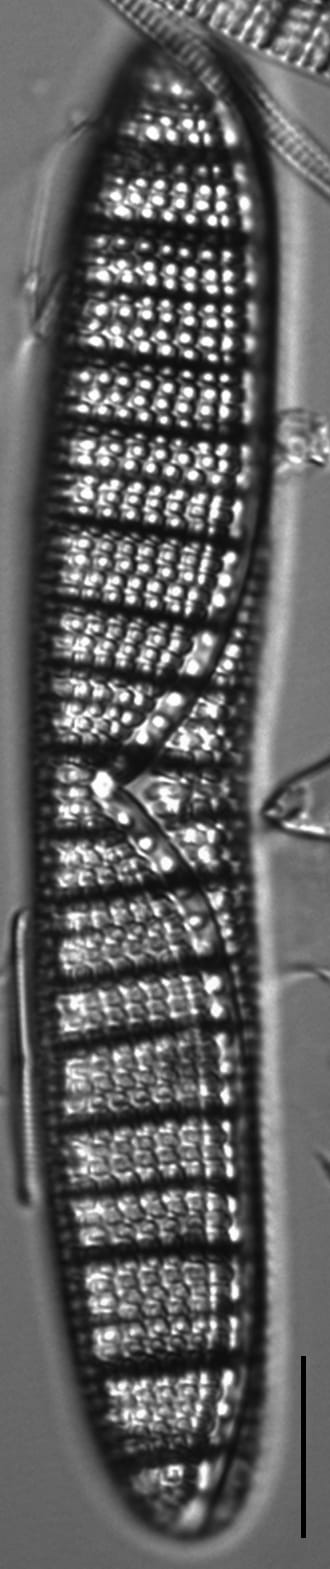
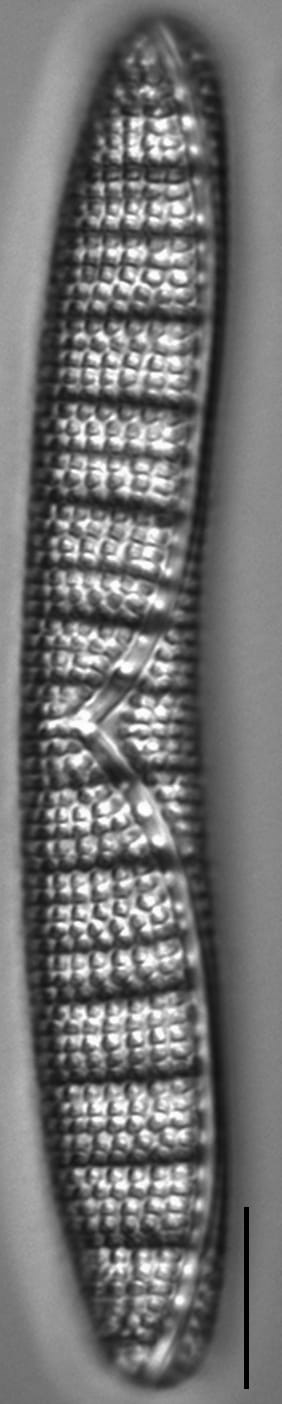
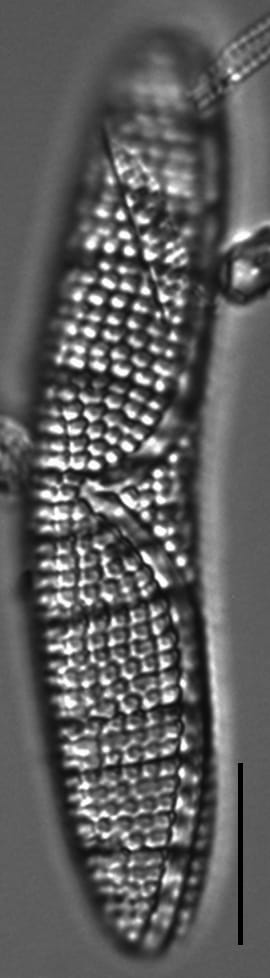
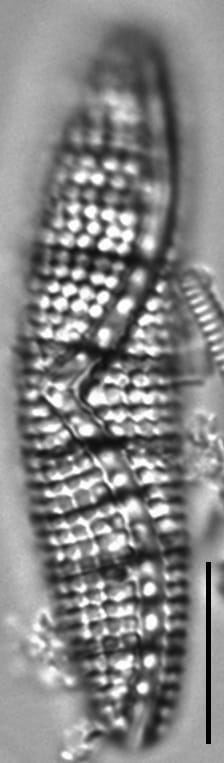
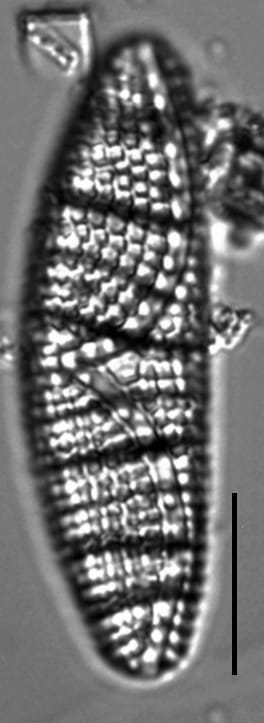
Valves are dorsiventral, with a convex dorsal margin and a slightly concave to nearly straight ventral margin. Valve apices are rounded. At mid valve, the raphe canal curves strongly toward the dorsal margin, so that the proximal raphe is positioned at, or above 2/3 of the width. The rest of the raphe canal is positioned on the ventral margin to the apices, except in larger specimens, where the distal raphe slightly curves toward the dorsal side. The areolae are coarse, with 4-6 striae between each costa. Costae number 1-4 in 10 µm.
Autecology
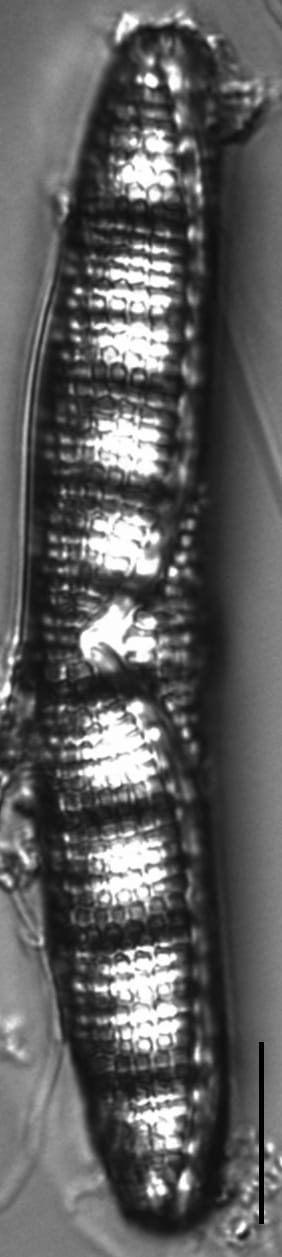
As in other species of Epithemia, E. argus may contain nitrogen-fixing endosymbiotic cyanobacteria. The endosymbionts enable the cells to become abundant in areas of low nitrogen concentrations. Epithemia argus was observed in a sample taken from a squeeze of moss at the edge of a small pool in Silver Lake Fen, Dickinson County, Iowa. This species tolerates high-alkaline, nutrient poor conditions.
Live Epithemia argus with intracellular spherical lipids, but endosymbiotic cyanobacteria are not evident. Collected from moss on the edge of a pool in Silver Lake Fen, DIckinison County, IA.
Meyers, D. (2014).
Epithemia argus.
In Diatoms of North America.
Retrieved May 23, 2026, from https://diatoms.org/species/47914/epithemia_argus
Responses
The 15 response plots show an environmental variable (x axis) against the relative abundance (y axis) of Epithemia argus from all the stream reaches where it was present. Note that the relative abundance scale is the same on each plot. Explanation of each environmental variable and units are as follows:
ELEVATION = stream reach elevation (meters) STRAHLER = distribution plot of the Strahler Stream Order SLOPE = stream reach gradient (degrees) W1_HALL = an index that is a measure of streamside (riparian) human activity that ranges from 0 - 10, with a value of 0 indicating of minimal disturbance to a value of 10 indicating severe disturbance. PHSTVL = pH measured in a sealed syringe sample (pH units) log_COND = log concentration of specific conductivity (µS/cm) log_PTL = log concentration of total phosphorus (µg/L) log_NO3 = log concentration of nitrate (µeq/L) log_DOC = log concentration of dissolved organic carbon (mg/L) log_SIO2 = log concentration of silicon (mg/L) log_NA = log concentration of sodium (µeq/L) log_HCO3 = log concentration of the bicarbonate ion (µeq/L) EMBED = percent of the stream substrate that is embedded by sand and fine sediment log_TURBIDITY = log of turbidity, a measure of cloudiness of water, in nephelometric turbidity units (NTU). DISTOT = an index of total human disturbance in the watershed that ranges from 1 - 100, with a value of 0 indicating of minimal disturbance to a value of 100 indicating severe disturbance.
Epithemia argus
(Ehrenb.) Kütz. 1844
Apices rounded
Proximal raphe positioned near dorsal margin
Most of raphe positioned along ventral margin
Valves are dorsiventral with a convex dorsal margin and a slightly concave to nearly straight ventral margin. Valve apices are distinctly rounded. The proximal raphe is positioned at, or above 2/3 of the valve width. The rest of the raphe canal is positioned on the ventral margin to the apices. The areolae are coarse, with 4-6 striae in...