
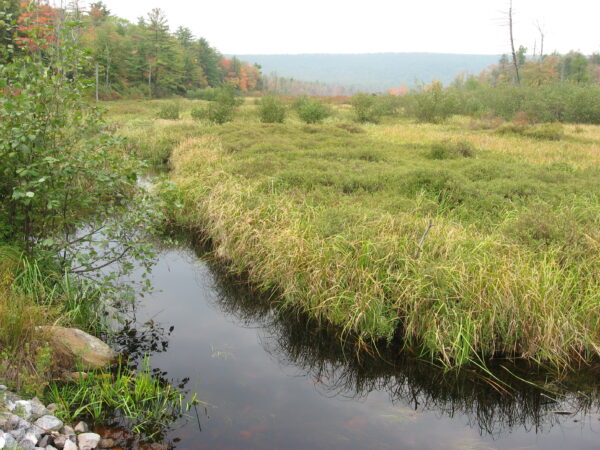
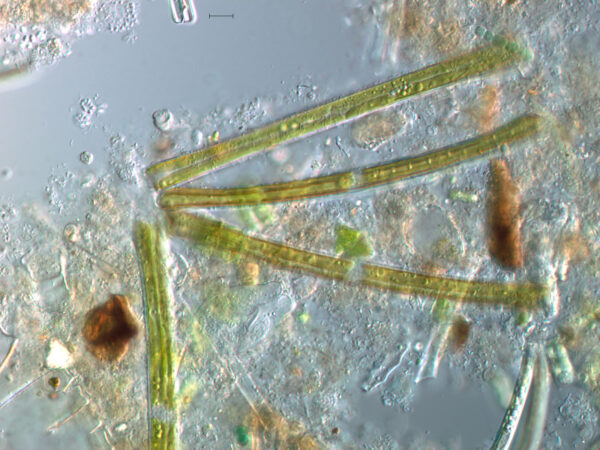
Credit: Photo by Lynn Brant
Bear Meadows Bog, Pennsylvania
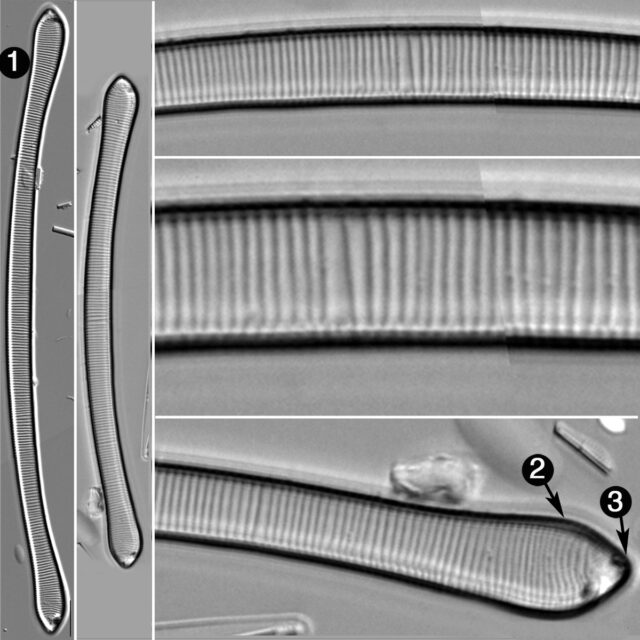
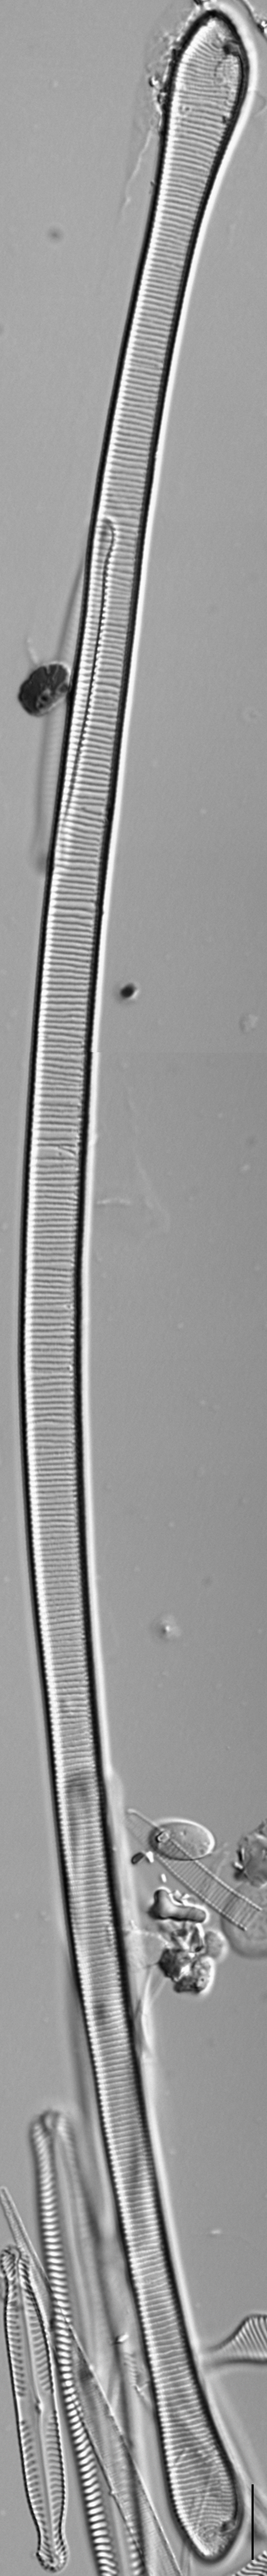
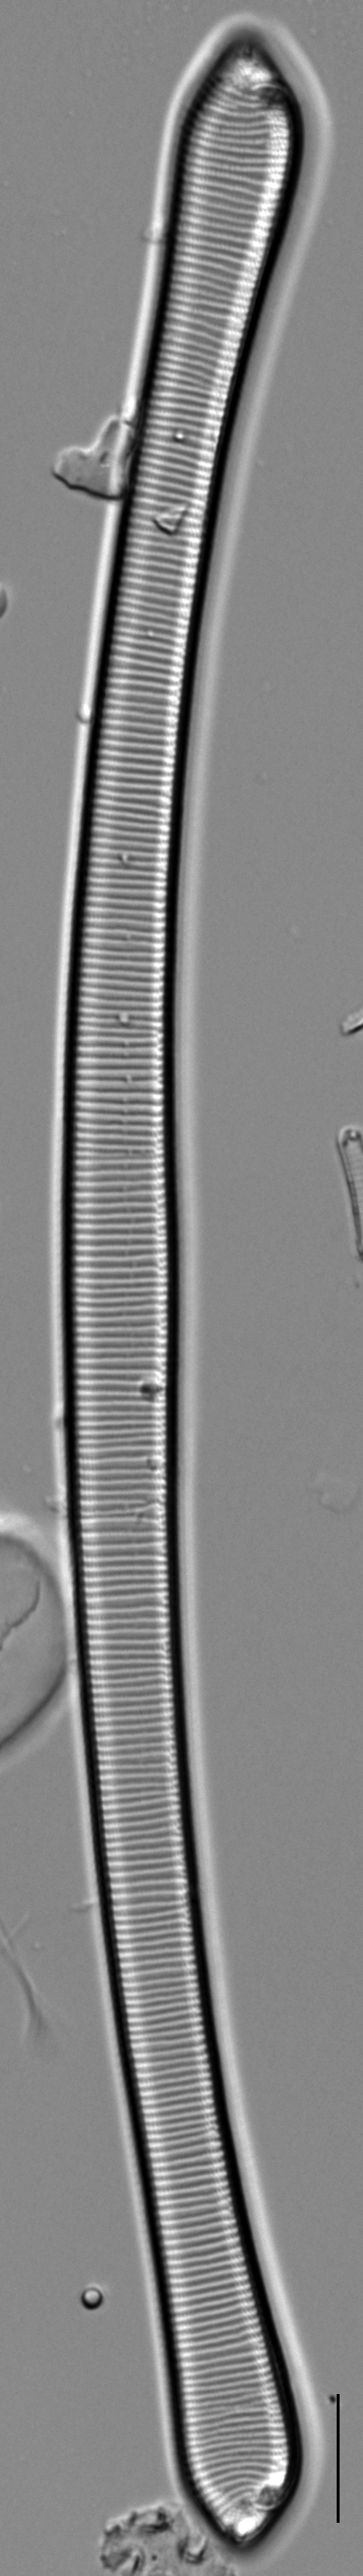
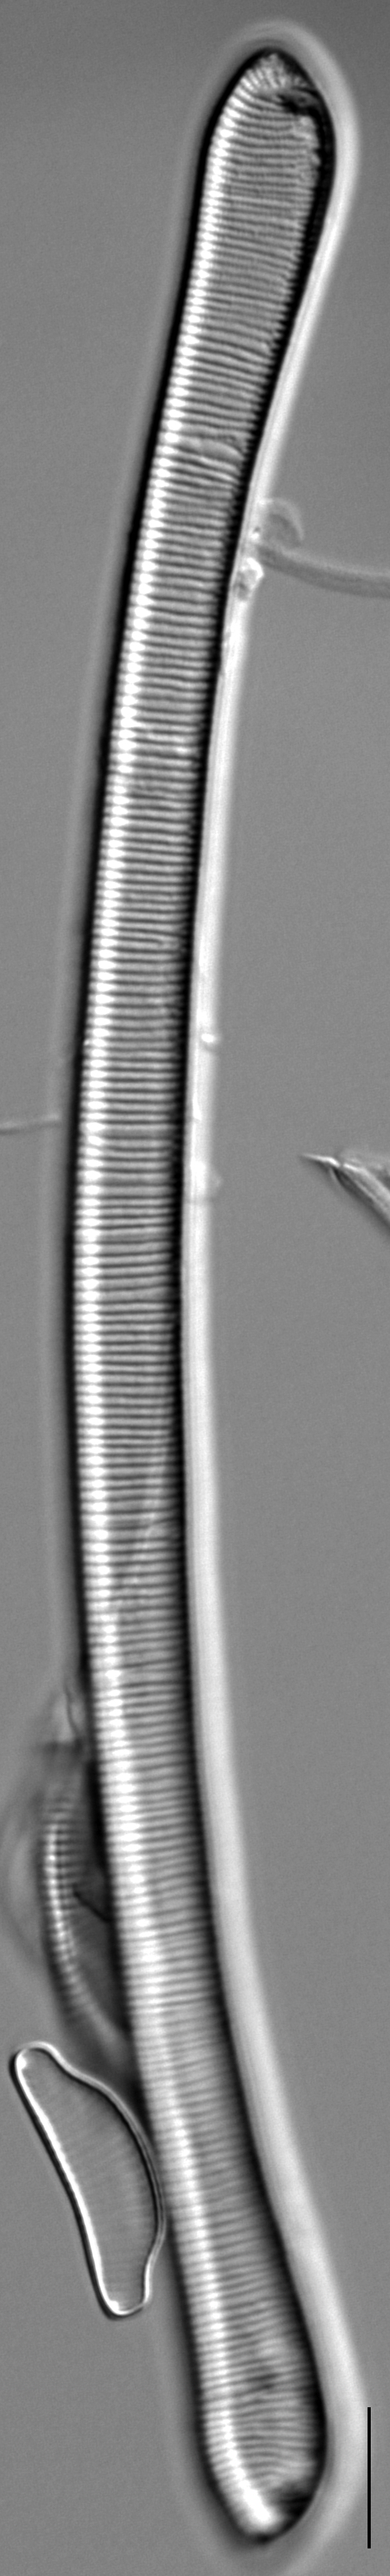
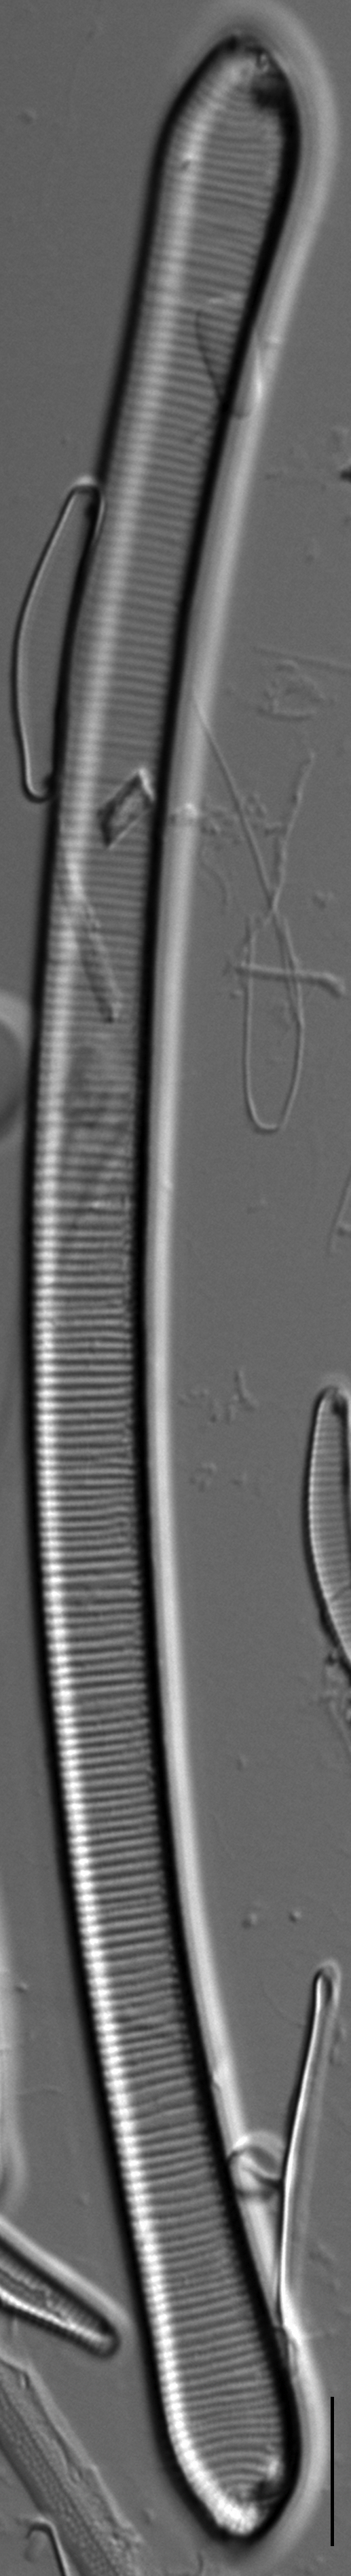
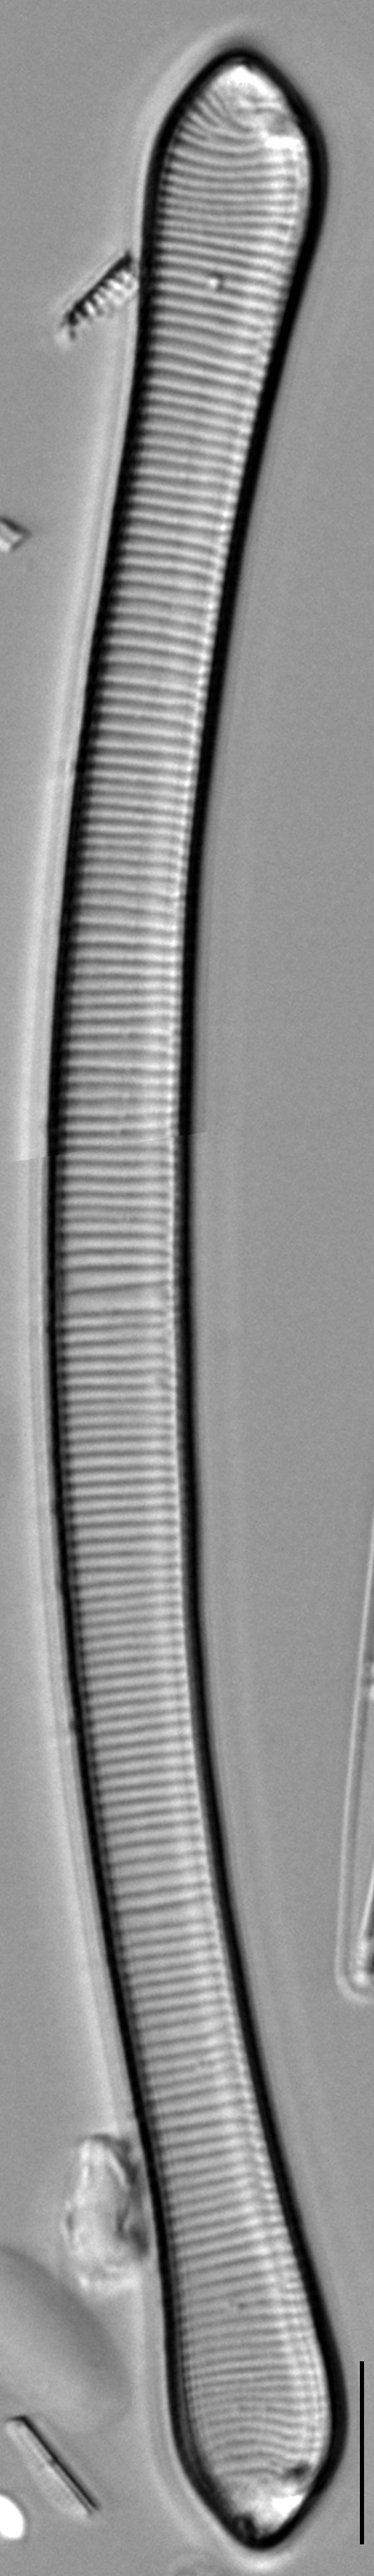
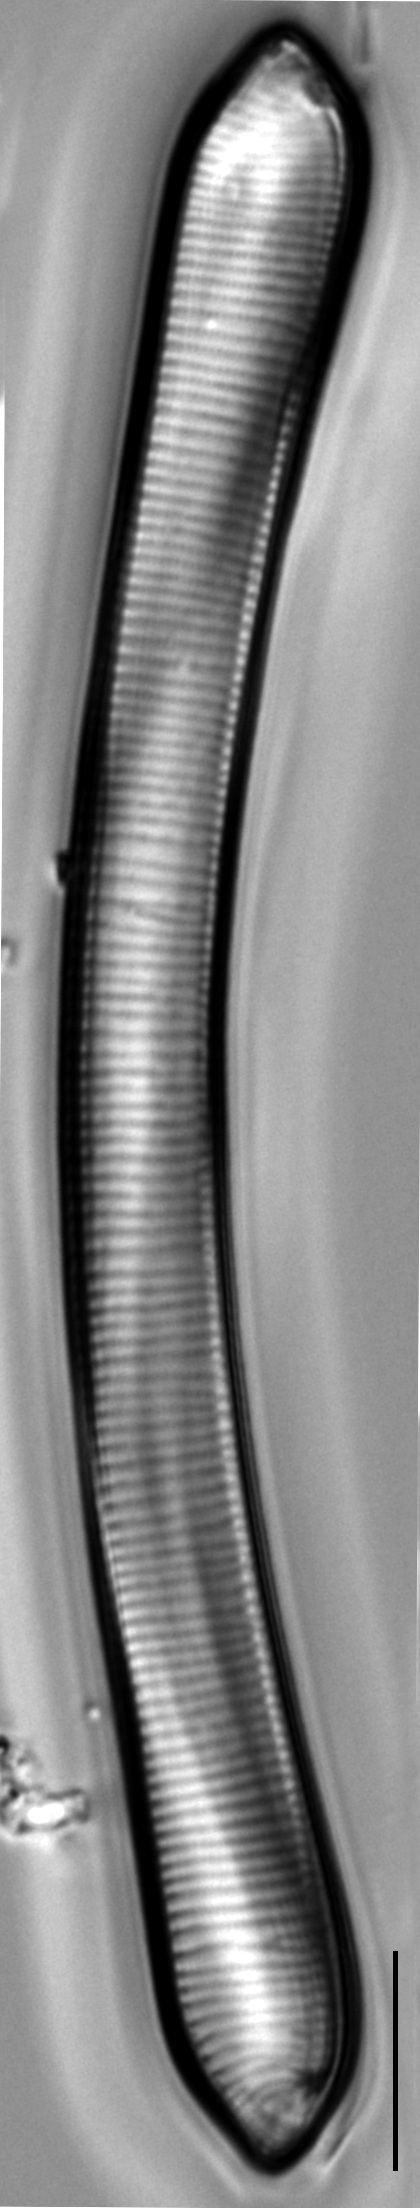
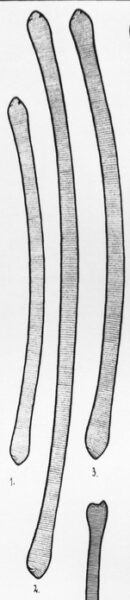
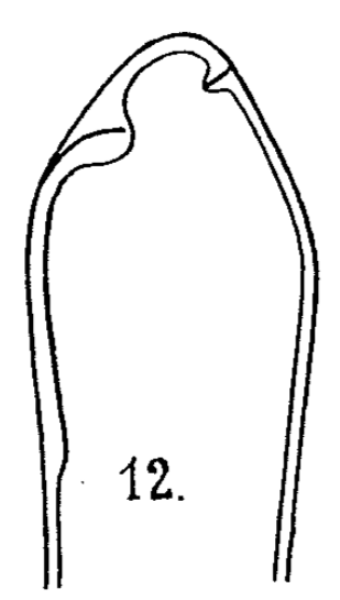
Valves and narrow and arcuate with a convex dorsal margin and a concave ventral margin. Apices are distinctly expanded, terminating with apiculate ends. A single rimoportula is often present on the dorsal side of the apex. A helictoglossa is present on the ventral side of the valve face, next to the valve apex. The raphe curves onto the ventral margin toward the valve center. Striae are perpendicular to the valve margin (occurring 12-14 in 10 µm) at the valve center, becoming more dense (14-16 in 10 µm) near the apices. In some specimens, the striae bifurcate at the ventral margin. Areolae are fine, occurring about 40 in 10 µm.
As Patrick (1945) pointed out, Hustedt (1913) invalidly described E. tauntoniensis by providing only a name and a figure. In 1926, however, Hustedt validated E. tauntoniensis by providing a diagnosis of the raphe as a distinguishing feature from other similar taxa. Therefore, Patrick (1945) is superfluous to Hustedt’s earlier nomenclatural validation.
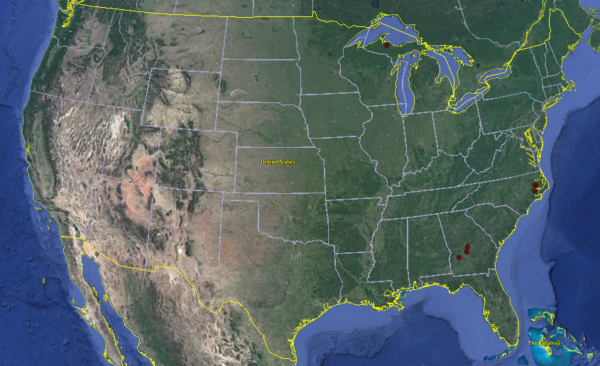
Here we observed E. tauntoniensis forming semi-stellate colonies in Bear Meadows Bog, a low pH (4.3-4.8) and low conductivity (19 to 38 µS) wetland in Appalachian Pennsylvania (Edlund and Brant 2010). Eunotia tauntoniensis has been reported from low pH lakes and wetlands of New England and the Atlantic Coastal Plain (Patrick and Reimer 1966, Camburn and Charles 2000, Gaiser and Johansen 2000, Siver and Hamilton 2011), as well as being observed here from wetlands in valleys of the Appalachian Mountains.
Updated the observed size range maximum from 255 to 337 microns and added an image of this specimen.
Burge, D., Brant, L., Edlund, M. (2016). Eunotia tauntoniensis. In Diatoms of North America. Retrieved July 26, 2024, from https://diatoms.org/species/eunotia_tauntoniensis
The 15 response plots show an environmental variable (x axis) against the relative abundance (y axis) of Eunotia tauntoniensis from all the stream reaches where it was present. Note that the relative abundance scale is the same on each plot. Explanation of each environmental variable and units are as follows:
ELEVATION = stream reach elevation (meters)
STRAHLER = distribution plot of the Strahler Stream Order
SLOPE = stream reach gradient (degrees)
W1_HALL = an index that is a measure of streamside (riparian) human activity that ranges from 0 - 10, with a value of 0 indicating of minimal disturbance to a value of 10 indicating severe disturbance.
PHSTVL = pH measured in a sealed syringe sample (pH units)
log_COND = log concentration of specific conductivity (µS/cm)
log_PTL = log concentration of total phosphorus (µg/L)
log_NO3 = log concentration of nitrate (µeq/L)
log_DOC = log concentration of dissolved organic carbon (mg/L)
log_SIO2 = log concentration of silicon (mg/L)
log_NA = log concentration of sodium (µeq/L)
log_HCO3 = log concentration of the bicarbonate ion (µeq/L)
EMBED = percent of the stream substrate that is embedded by sand and fine sediment
log_TURBIDITY = log of turbidity, a measure of cloudiness of water, in nephelometric turbidity units (NTU).
DISTOT = an index of total human disturbance in the watershed that ranges from 1 - 100, with a value of 0 indicating of minimal disturbance to a value of 100 indicating severe disturbance.