

Credit: USGS BioData
Distribution of Gyrosigma attenuatum in the continental U.S. rivers sampled for the National Water Quality Assessment program. Retrieved on June 15, 2015.

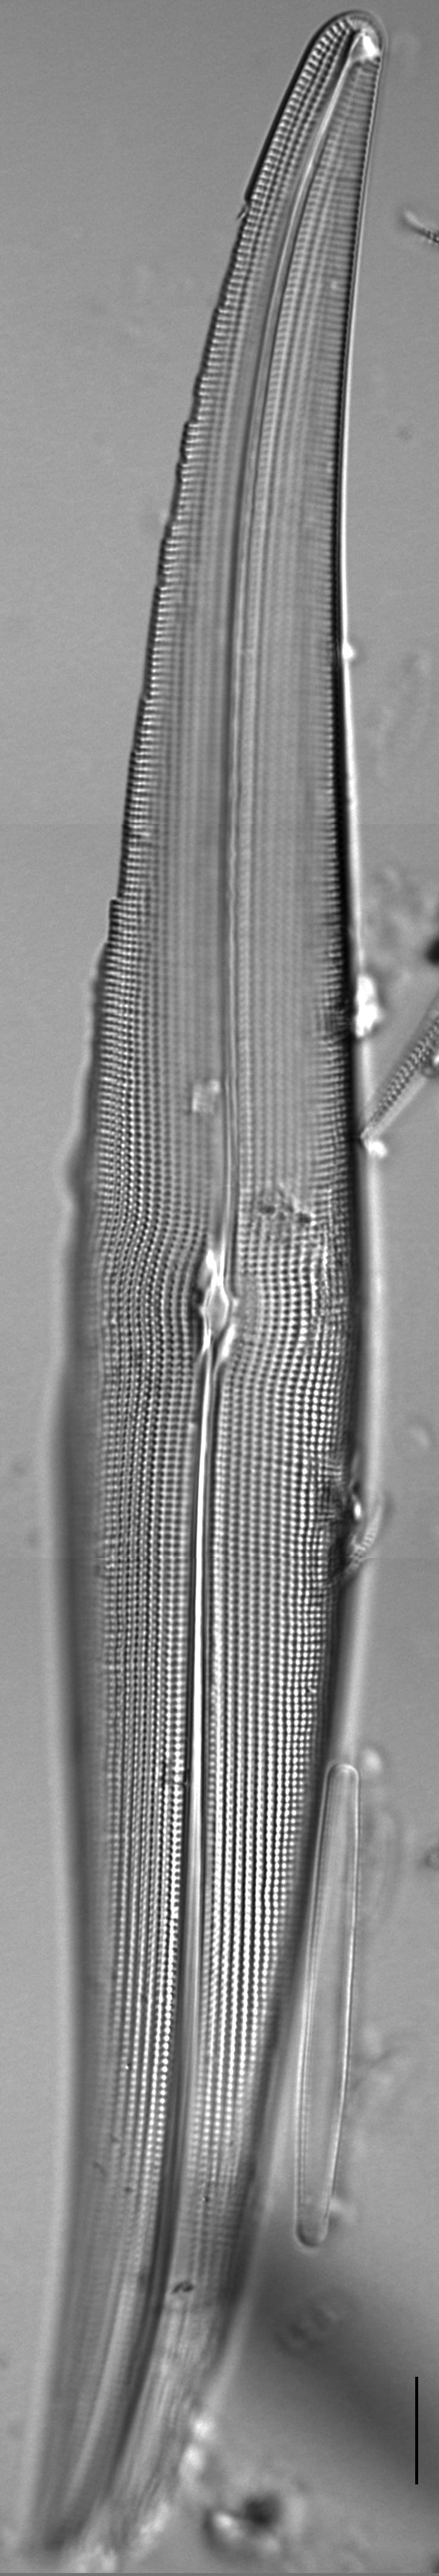
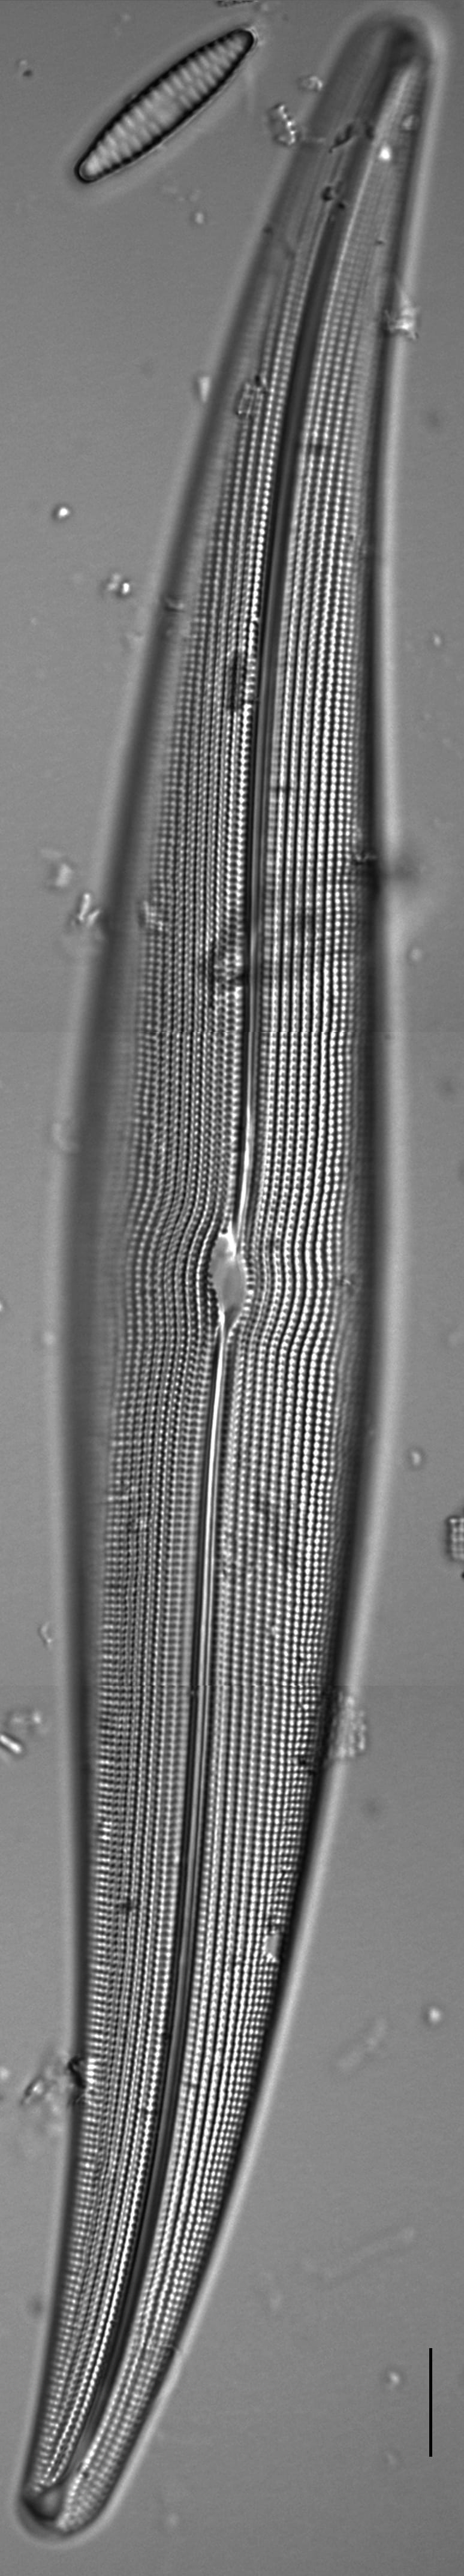
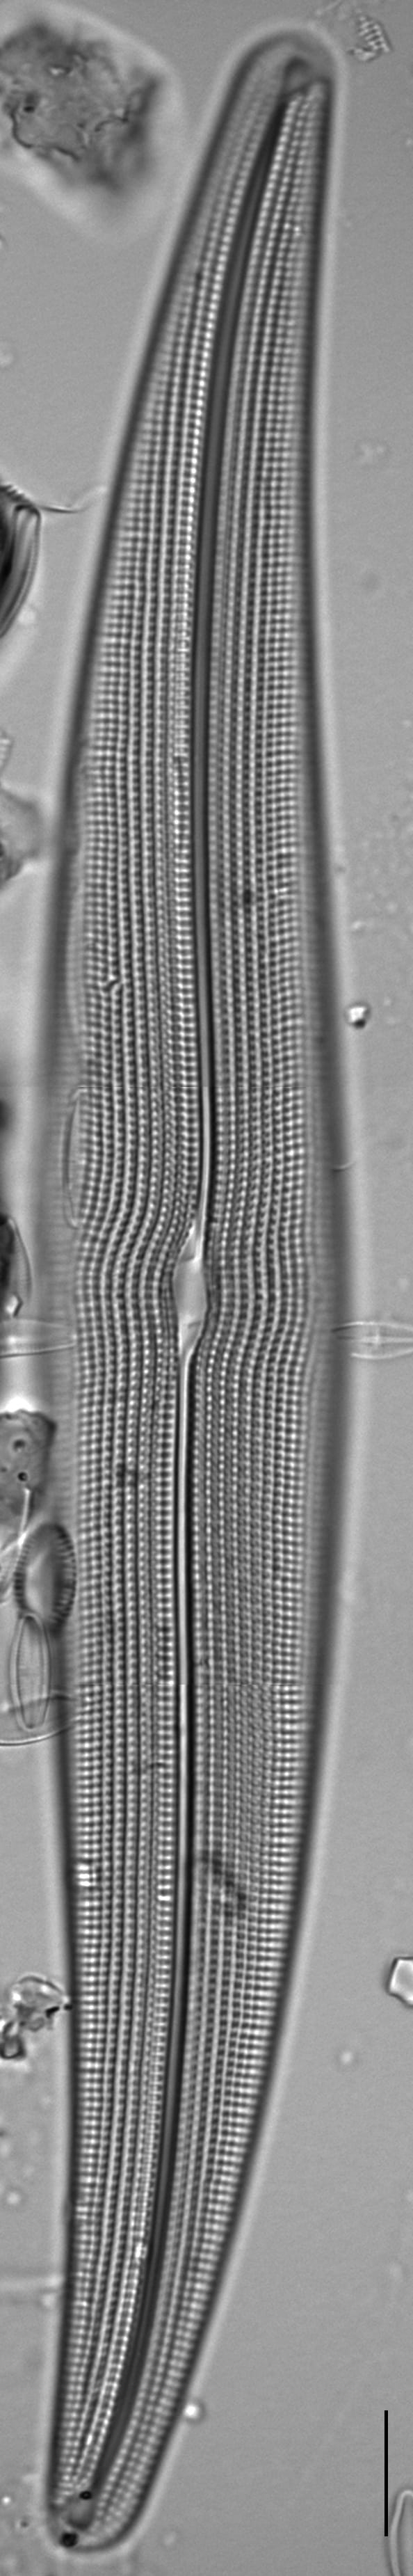
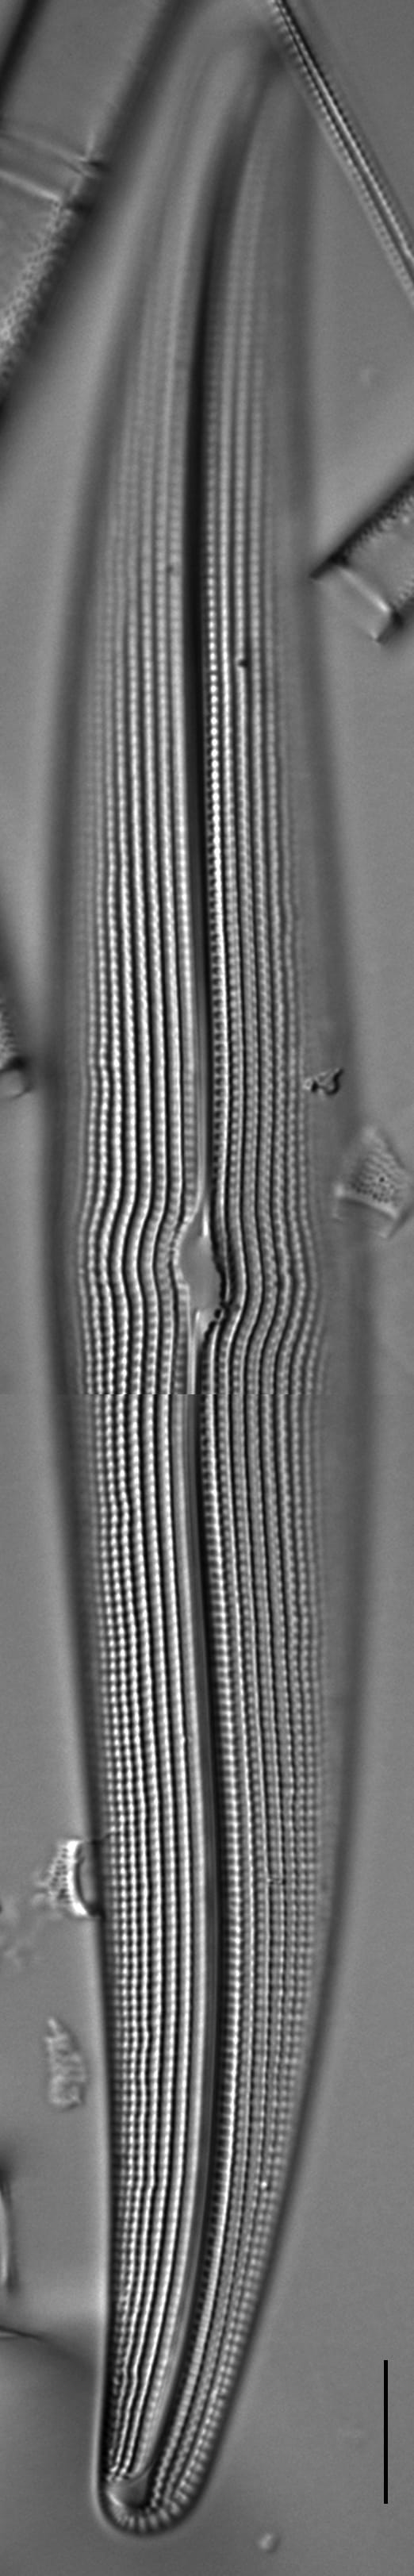
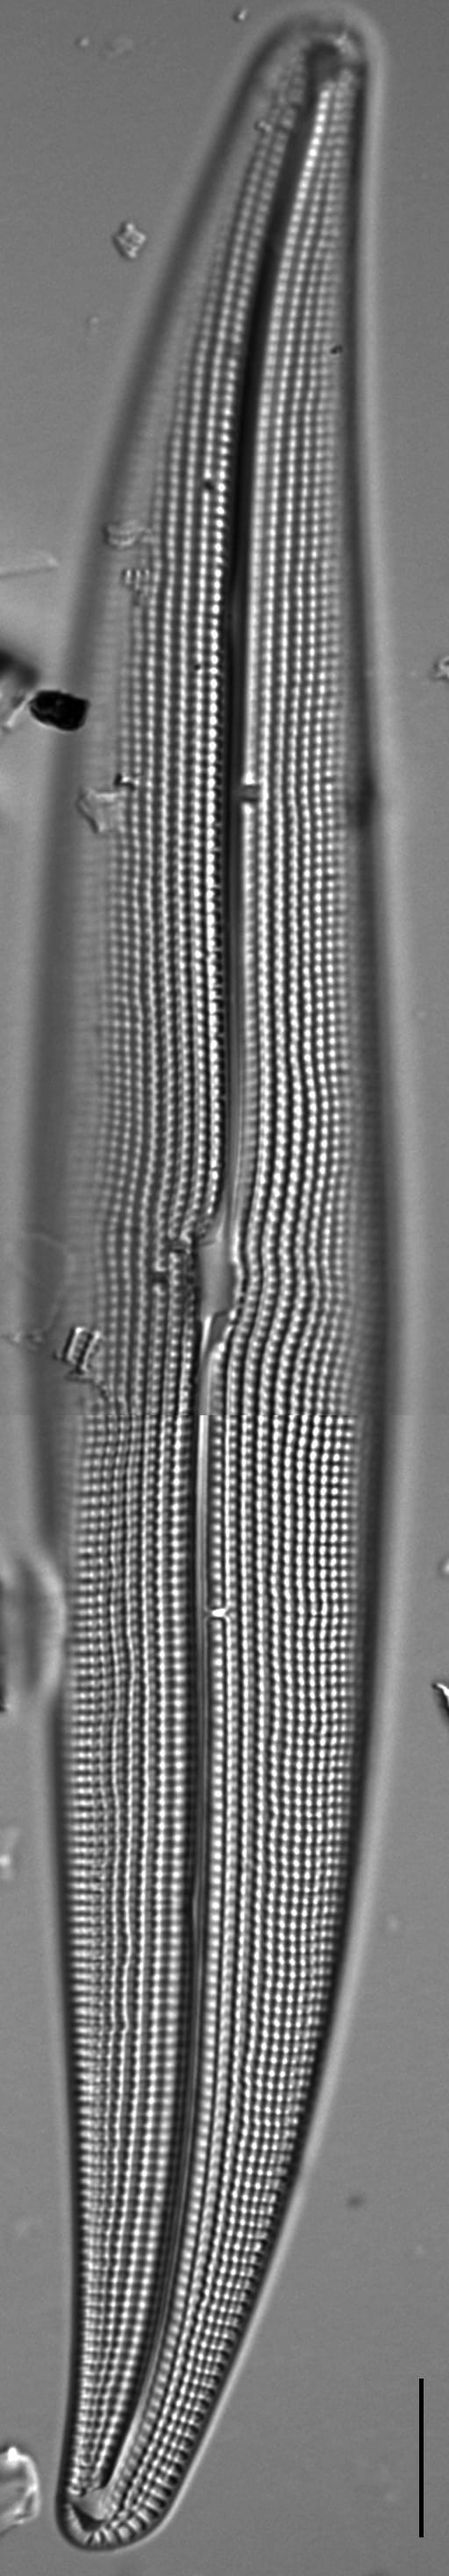
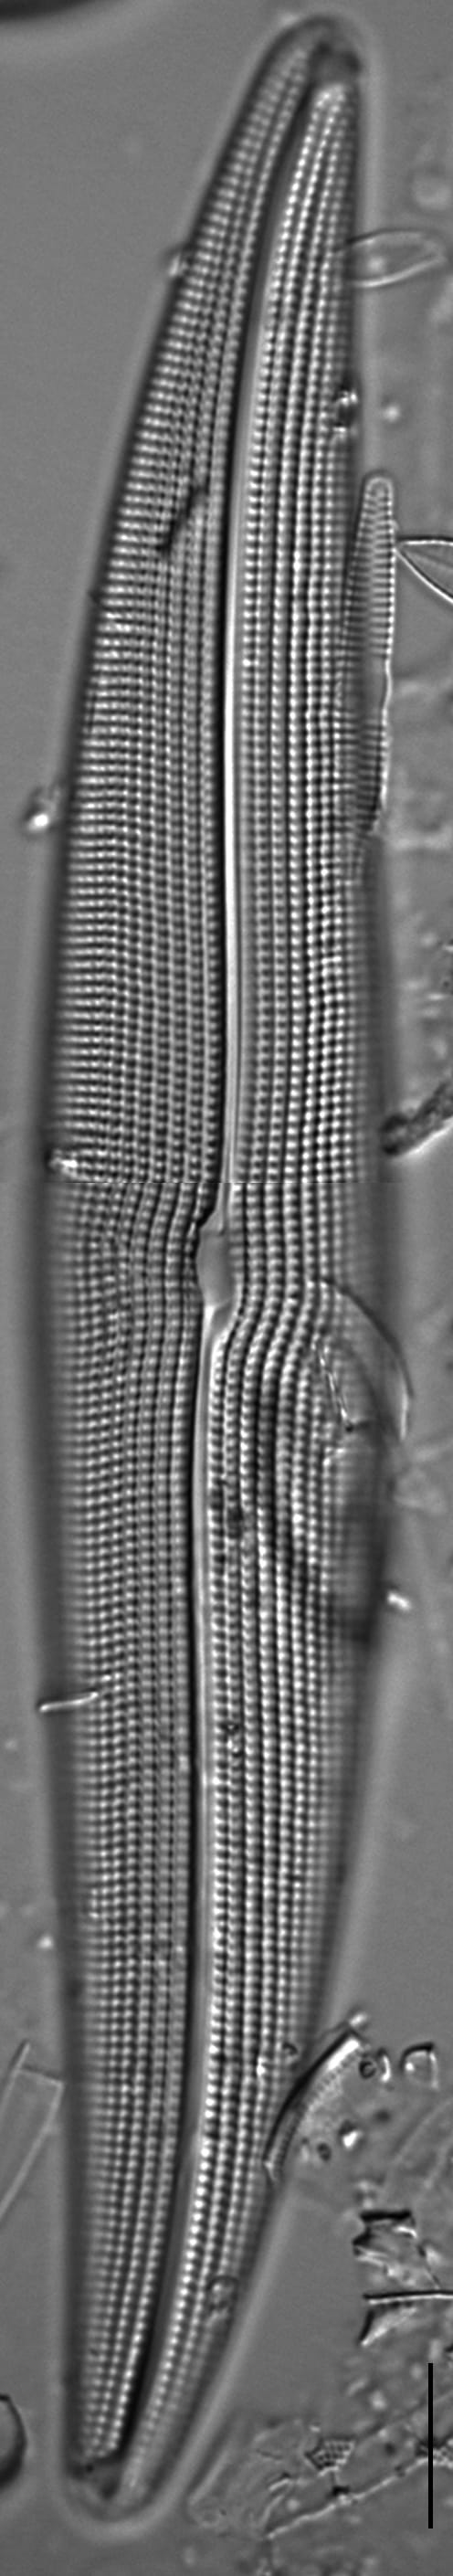
Valves are narrowly lanceolate and moderately sigmoid. The central area is small, longitudinally elliptical and, in some cases, irregular. The raphe is straight for at least 2/3 of its length and positioned in the center of the valve. Near the apices, the raphe becomes sigmoid. The proximal raphe ends are deflected to opposite sides of the valve near to where the axial area widens to form the central area. The axial area is narrow, widening at each end of the valve into a triangular shape. The distal raphe ends are deflected to opposite directions. The longitudinal striae are parallel to the axial area, including at the center of the valve where the central area widens. The longitudinal striae are more coarse than the transverse striae.
Gyrosigma attenuatum is widely distributed in the U.S. (Patrick and Reimer 1966), but is rarely found in high densities in water bodies (Lange-Bertalot 2011). This species prefers alkaline water environments and is relatively sensitive to organic load from outflows in its environment (Lange-Bertalot 2011).


Gauthier, J. (2015). Gyrosigma attenuatum. In Diatoms of North America. Retrieved July 26, 2026, from https://diatoms.org/species/50598/gyrosigma_attenuatum
The 15 response plots show an environmental variable (x axis) against the relative abundance (y axis) of Gyrosigma attenuatum from all the stream reaches where it was present. Note that the relative abundance scale is the same on each plot. Explanation of each environmental variable and units are as follows:
ELEVATION = stream reach elevation (meters)
STRAHLER = distribution plot of the Strahler Stream Order
SLOPE = stream reach gradient (degrees)
W1_HALL = an index that is a measure of streamside (riparian) human activity that ranges from 0 - 10, with a value of 0 indicating of minimal disturbance to a value of 10 indicating severe disturbance.
PHSTVL = pH measured in a sealed syringe sample (pH units)
log_COND = log concentration of specific conductivity (µS/cm)
log_PTL = log concentration of total phosphorus (µg/L)
log_NO3 = log concentration of nitrate (µeq/L)
log_DOC = log concentration of dissolved organic carbon (mg/L)
log_SIO2 = log concentration of silicon (mg/L)
log_NA = log concentration of sodium (µeq/L)
log_HCO3 = log concentration of the bicarbonate ion (µeq/L)
EMBED = percent of the stream substrate that is embedded by sand and fine sediment
log_TURBIDITY = log of turbidity, a measure of cloudiness of water, in nephelometric turbidity units (NTU).
DISTOT = an index of total human disturbance in the watershed that ranges from 1 - 100, with a value of 0 indicating of minimal disturbance to a value of 100 indicating severe disturbance.