Nitzschia acicularis

-
Category
-
Length Range30.0-100.0 µm
-
Width Range3.0-4.0 µm
-
ContributorPat Kociolek - Sep 2011
-
ReviewerSarah Spaulding - Sep 2012
Identification


Description
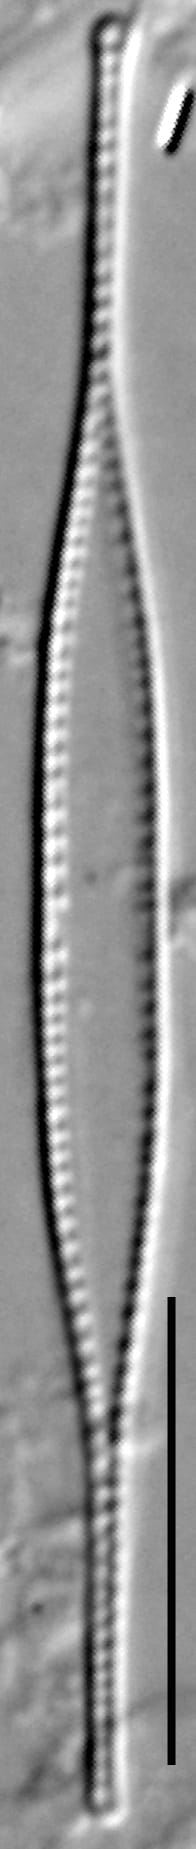
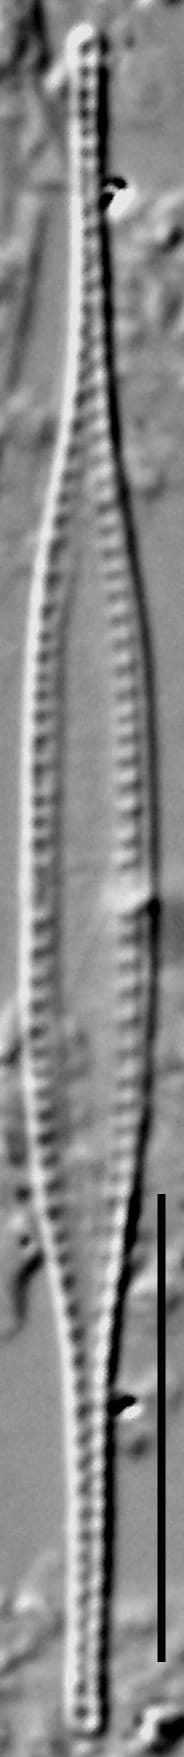
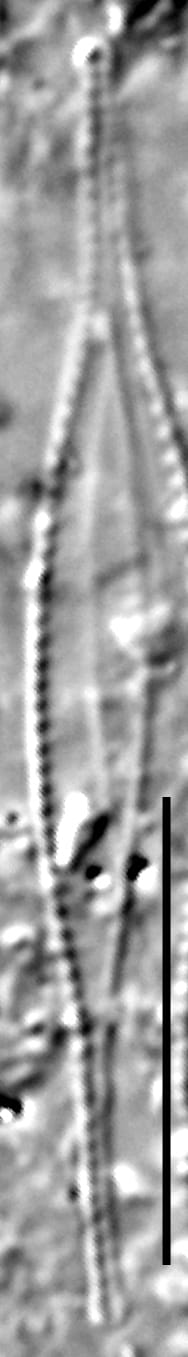
Valves are lightly-silicified. The central part of the valve has nearly parallel sides and a sharp tapering to narrow apices. The fibulae are fine and restricted to the margin, with a density 16-21 in 10 µm. The fibulae are evenly spaced through the central valve. That is, a "central nodule" is absent. The striae are not visible with light microscopy.
Note that N. acicularis is commonly confused with N. draveillensis. These two taxa are distinguished by the spacing of the fibulae in the center of the valve.
Autecology
-
Size Range, µm3
-
Motility
-
Attachment
-
Habitat
-
BCG
-
Waterbody
-
Distribution
- Learn more about this
Original Description
-
BasionymSynedra acicularis
-
AuthorKütz. 1844
Original Images

Citations & Links
Citations
Links
-
Index Nominum Algarum
-
GenBank
-
North American Diatom Ecological DatabaseNADED ID: 48002
Cite This Page
Kociolek, P. (2011). Nitzschia acicularis. In Diatoms of North America. Retrieved July 26, 2026, from https://diatoms.org/species/46791/nitzschia_acicularis
Responses
The 15 response plots show an environmental variable (x axis) against the relative abundance (y axis) of Nitzschia acicularis from all the stream reaches where it was present. Note that the relative abundance scale is the same on each plot. Explanation of each environmental variable and units are as follows:
ELEVATION = stream reach elevation (meters)
STRAHLER = distribution plot of the Strahler Stream Order
SLOPE = stream reach gradient (degrees)
W1_HALL = an index that is a measure of streamside (riparian) human activity that ranges from 0 - 10, with a value of 0 indicating of minimal disturbance to a value of 10 indicating severe disturbance.
PHSTVL = pH measured in a sealed syringe sample (pH units)
log_COND = log concentration of specific conductivity (µS/cm)
log_PTL = log concentration of total phosphorus (µg/L)
log_NO3 = log concentration of nitrate (µeq/L)
log_DOC = log concentration of dissolved organic carbon (mg/L)
log_SIO2 = log concentration of silicon (mg/L)
log_NA = log concentration of sodium (µeq/L)
log_HCO3 = log concentration of the bicarbonate ion (µeq/L)
EMBED = percent of the stream substrate that is embedded by sand and fine sediment
log_TURBIDITY = log of turbidity, a measure of cloudiness of water, in nephelometric turbidity units (NTU).
DISTOT = an index of total human disturbance in the watershed that ranges from 1 - 100, with a value of 0 indicating of minimal disturbance to a value of 100 indicating severe disturbance.
Nitzschia acicularis
- Valves long, narrow
- Apices straight
- Fibulae evenly spaced at valve center
Valves are very lightly silicified. Apices are long, narrow, and straight. At the center of the valve, the margins are nearly parallel. The striae are fine and number more than 40 in 10 µm.