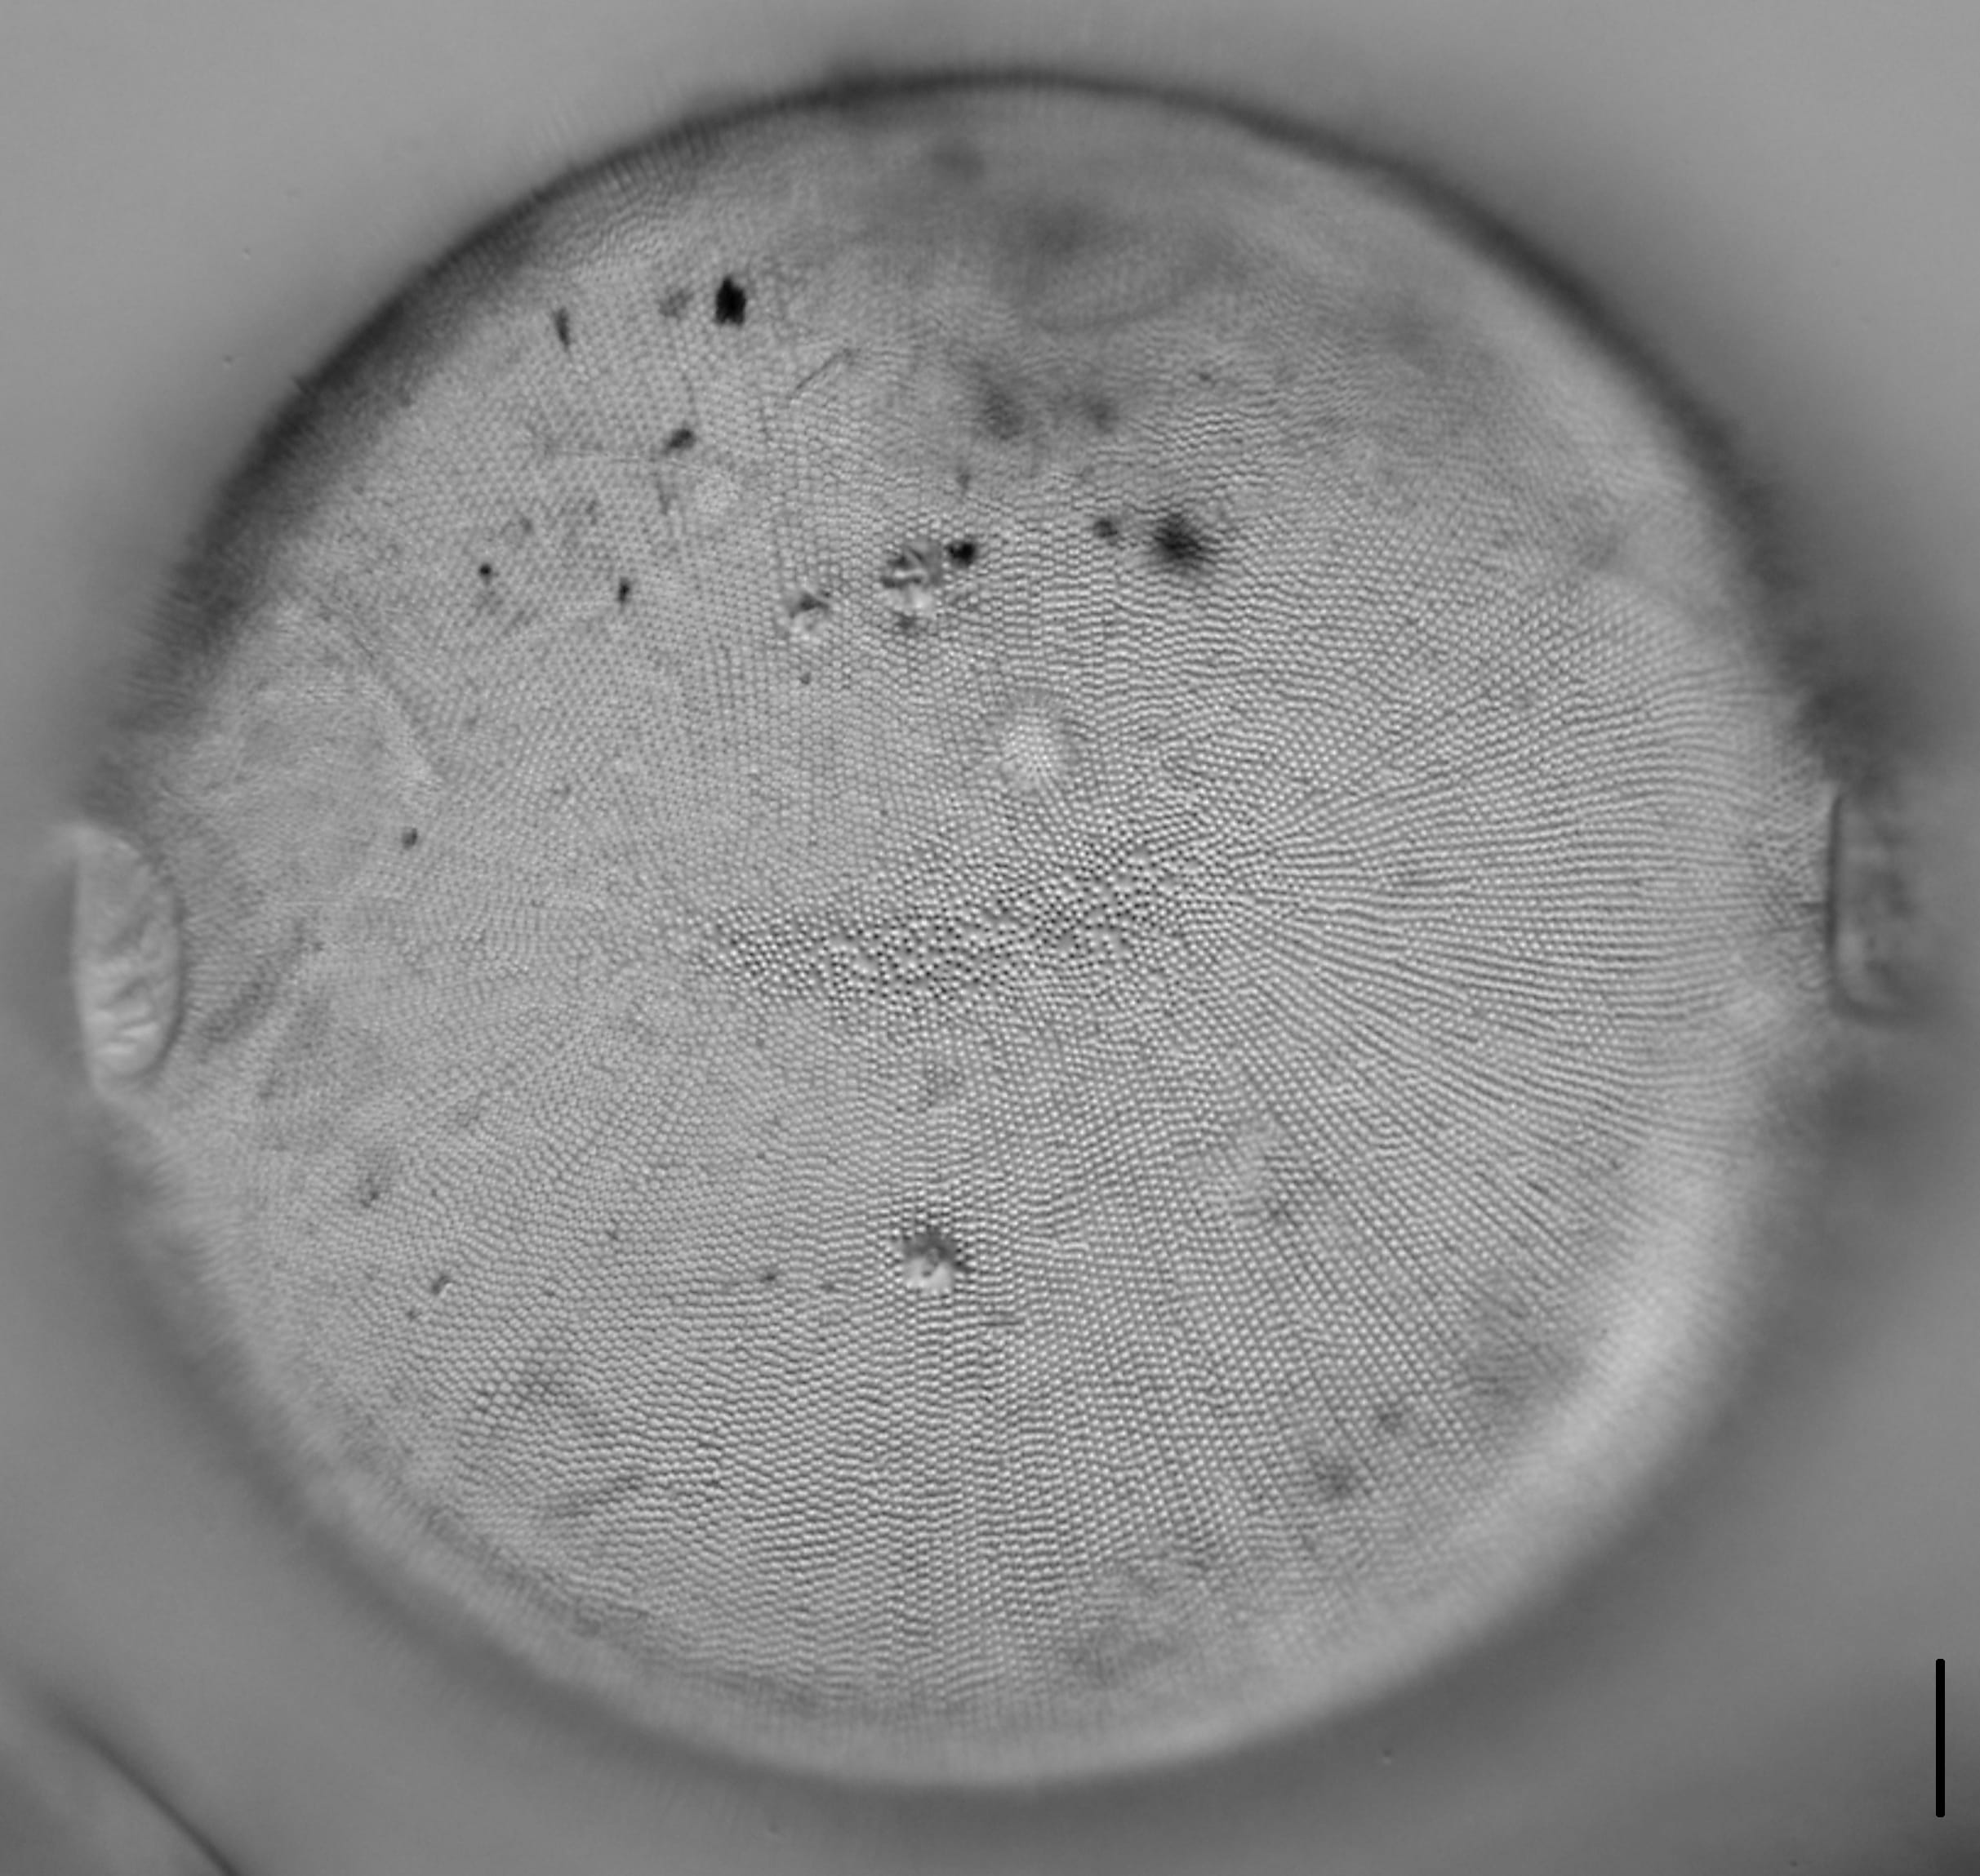
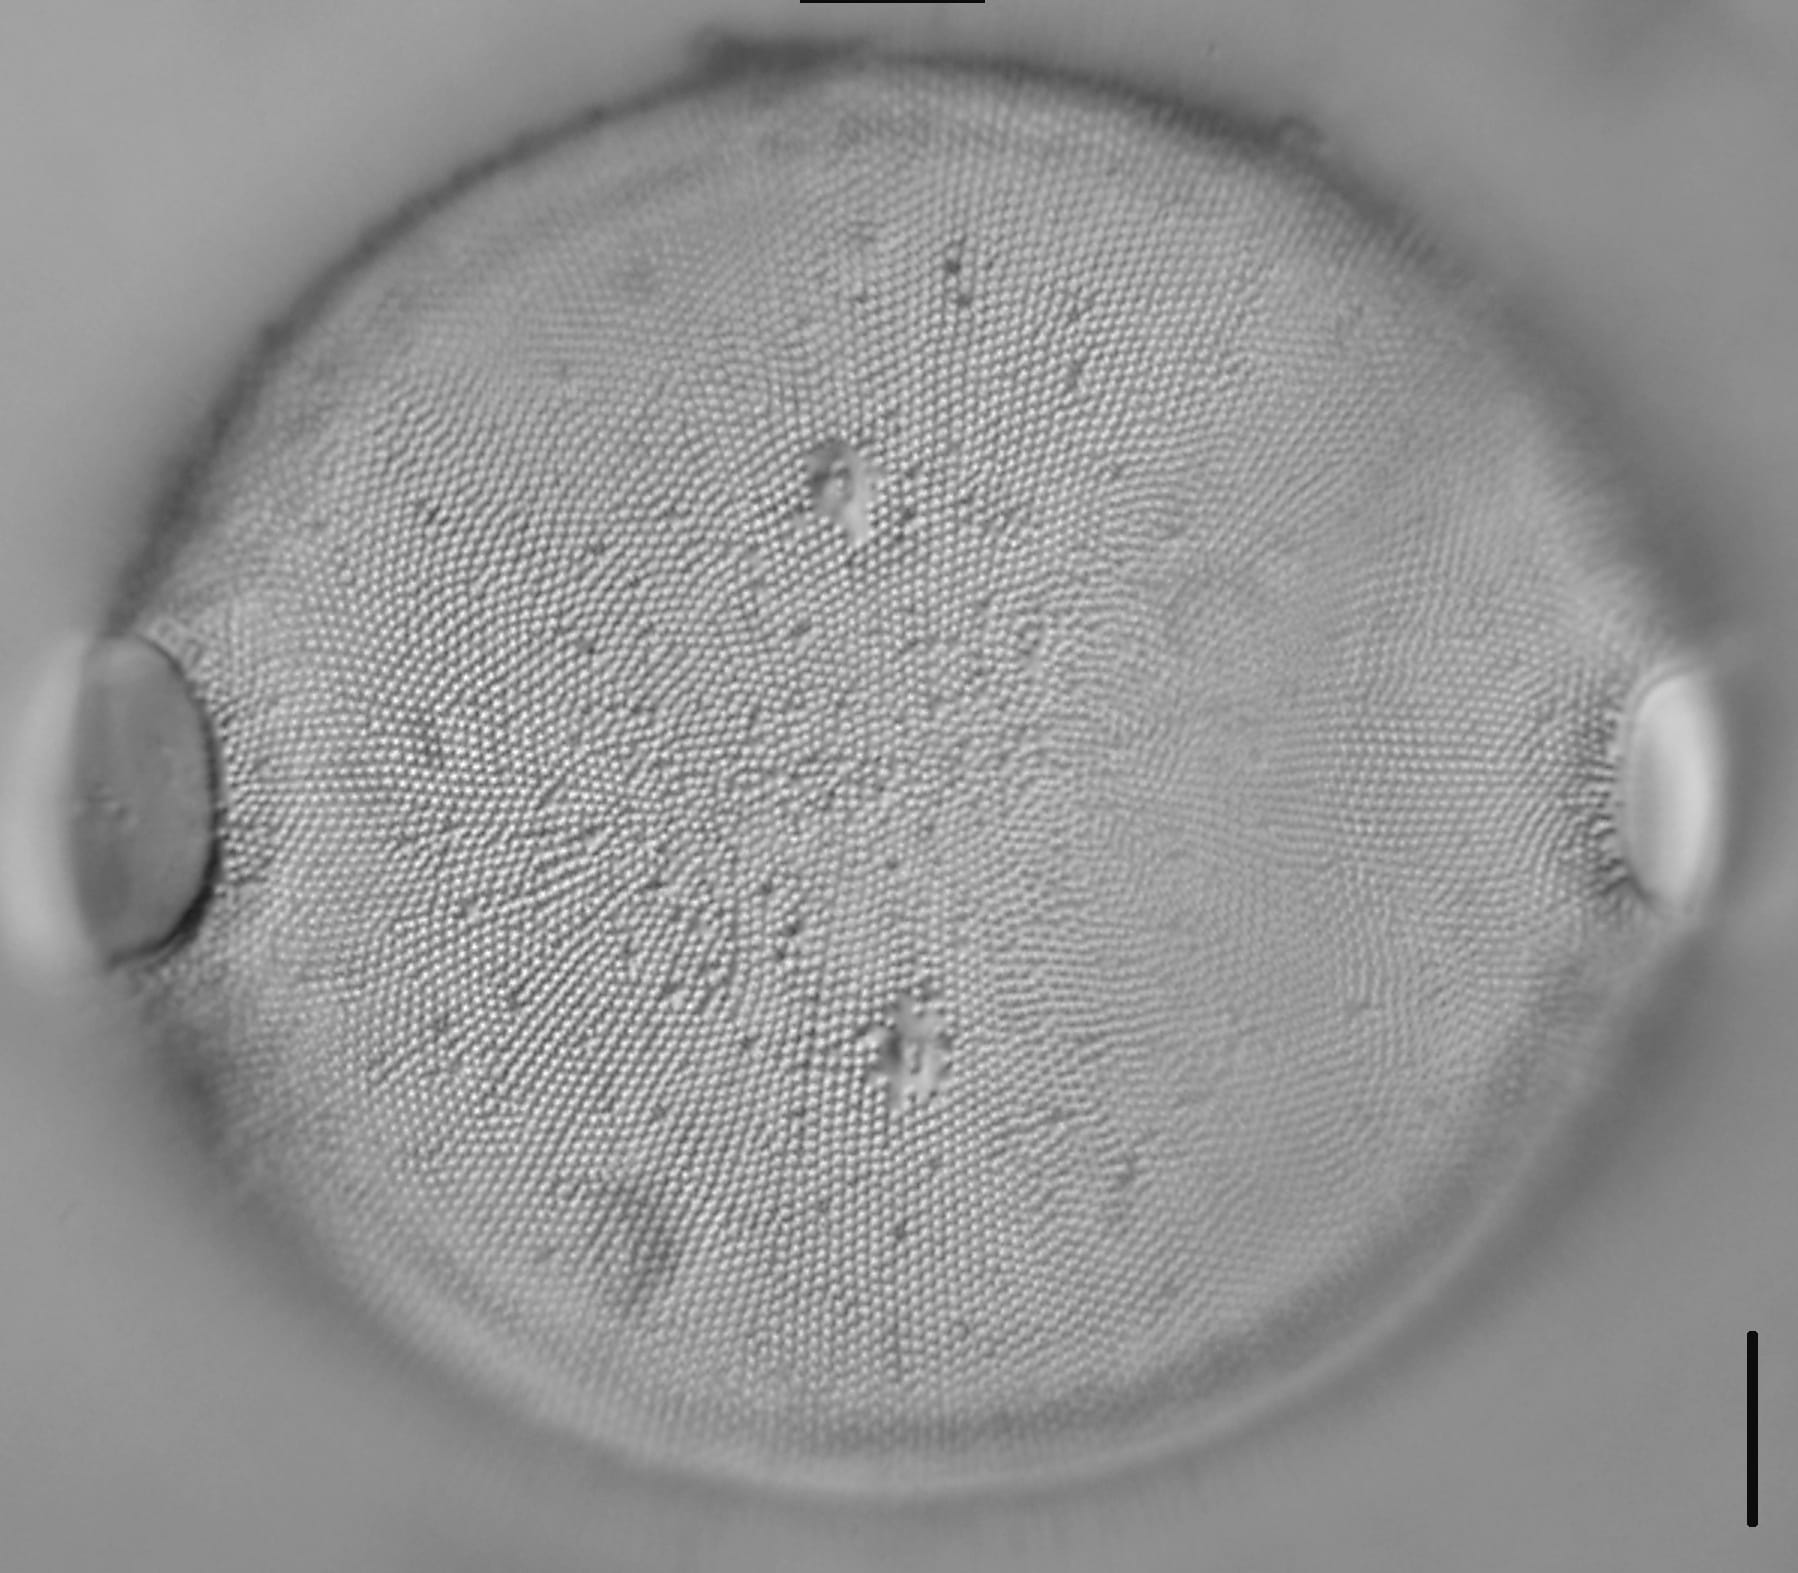
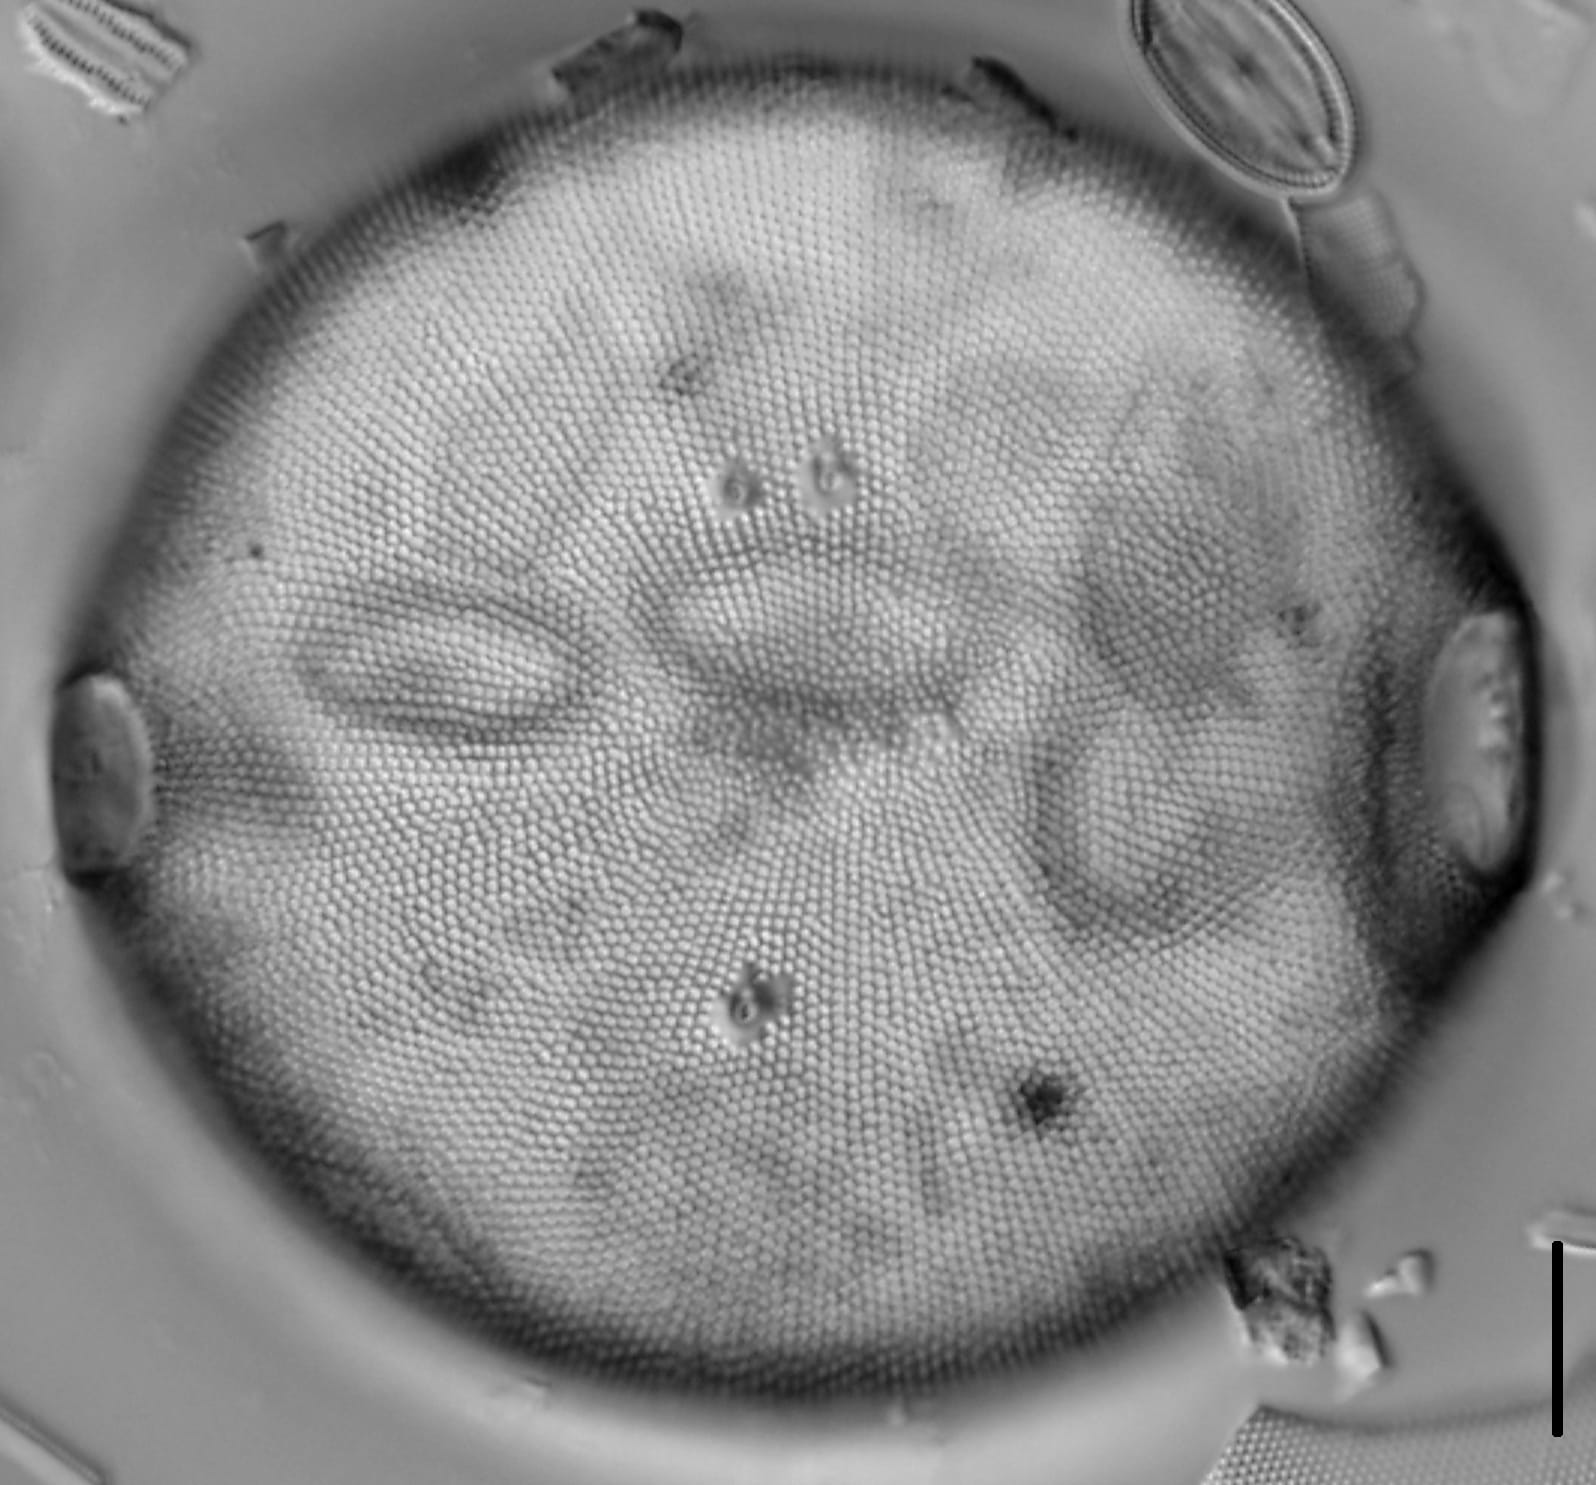
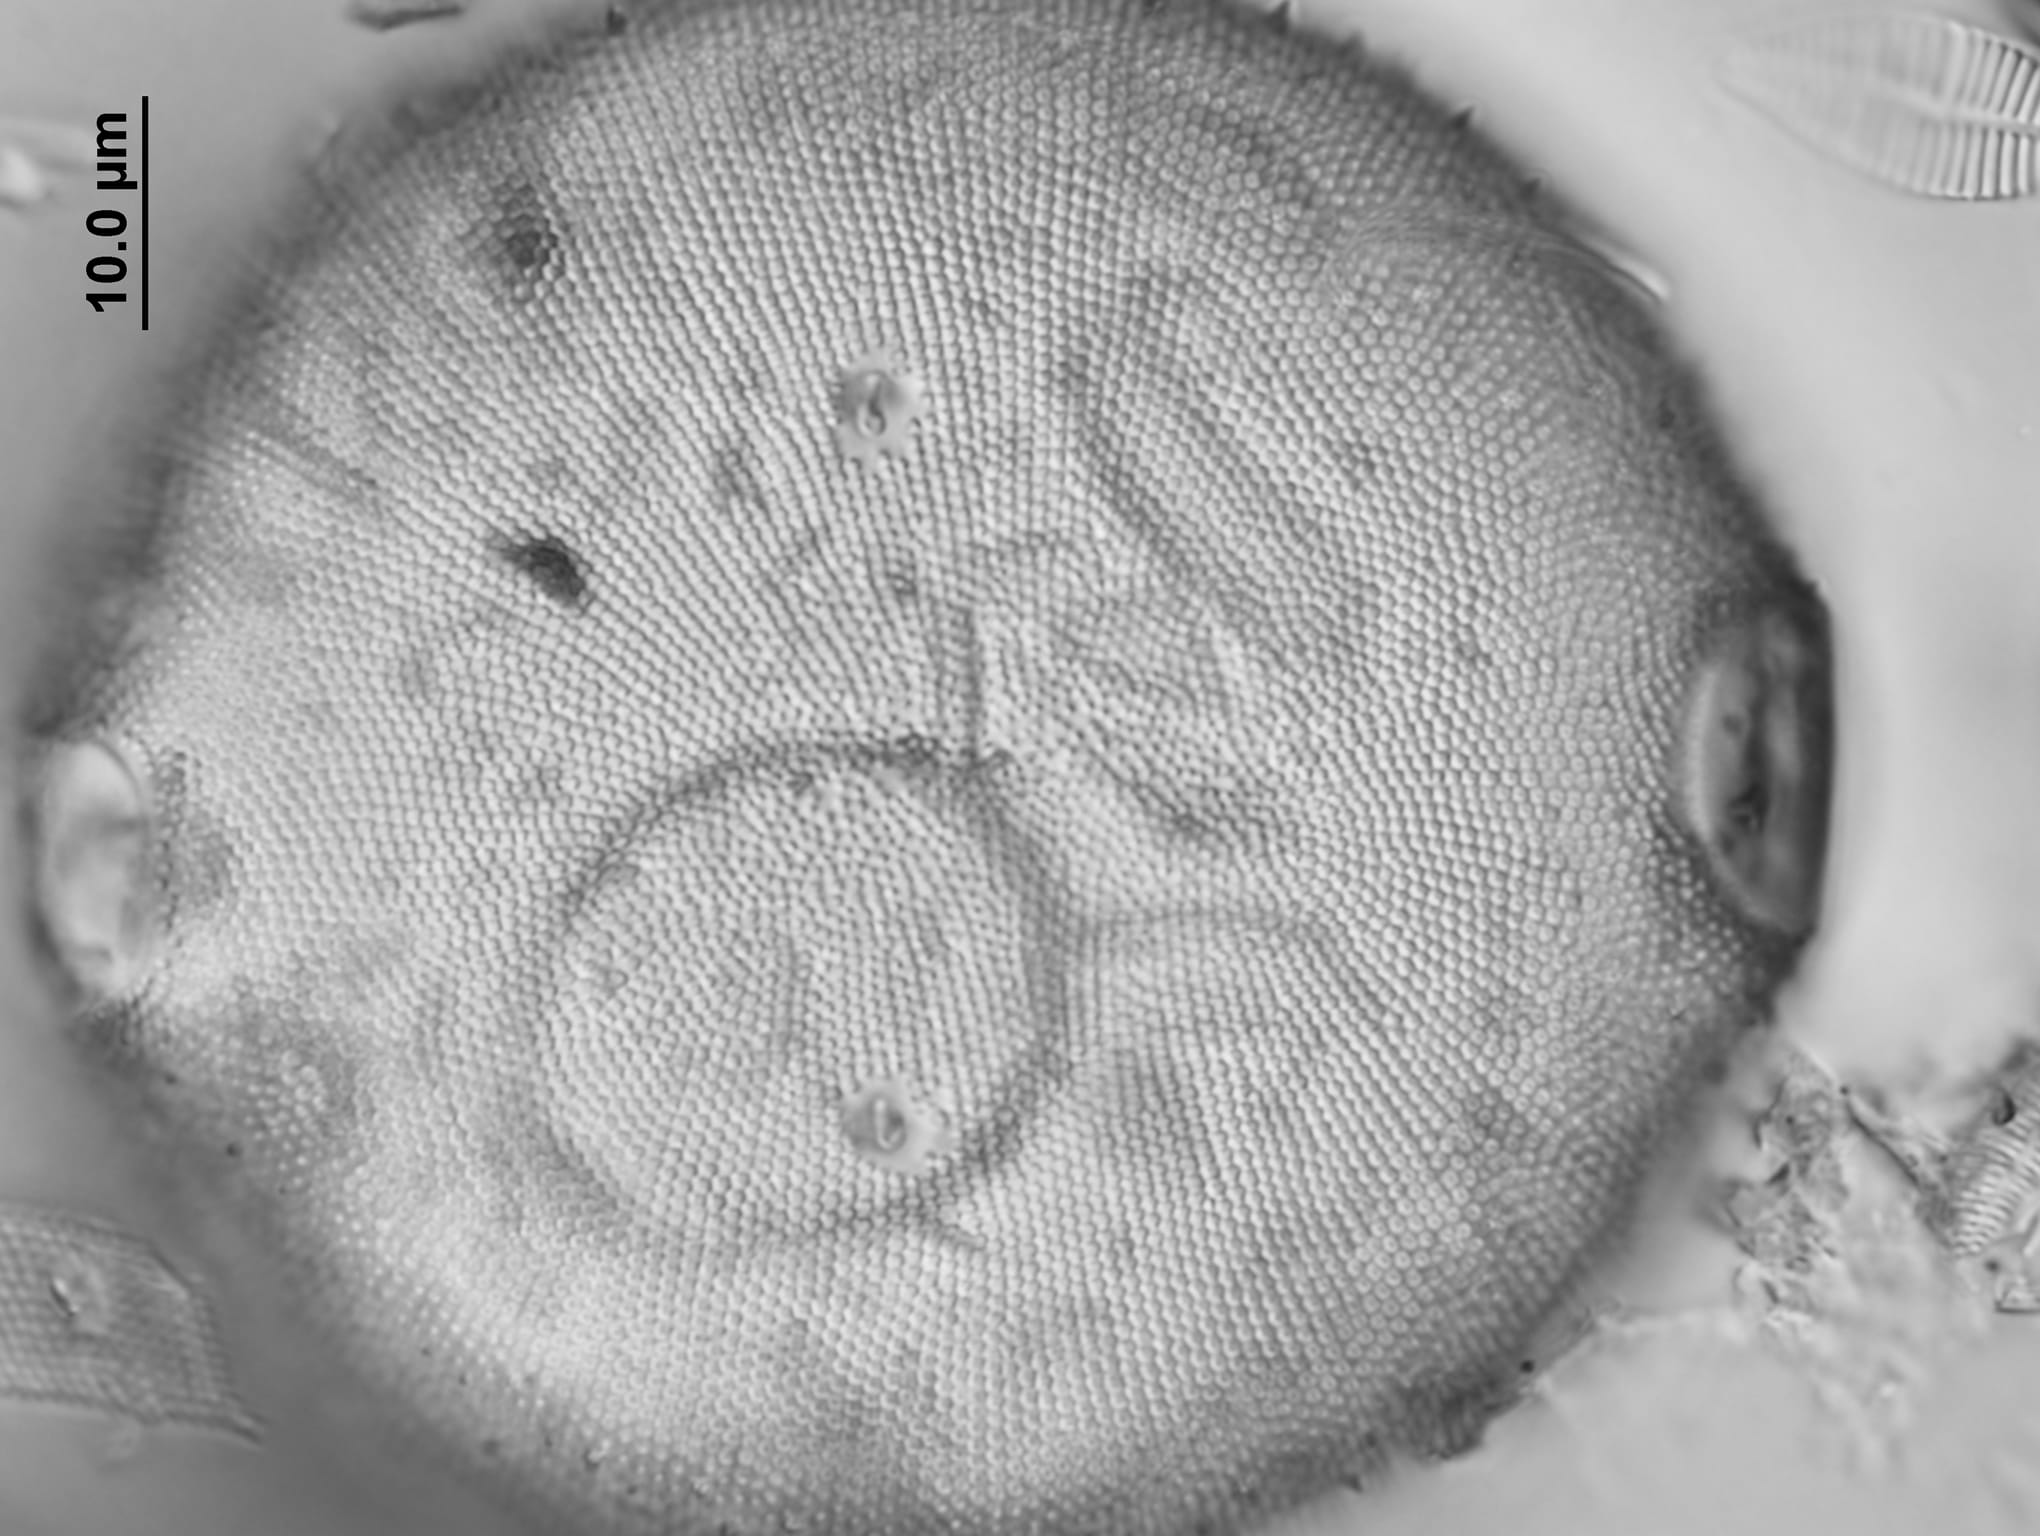
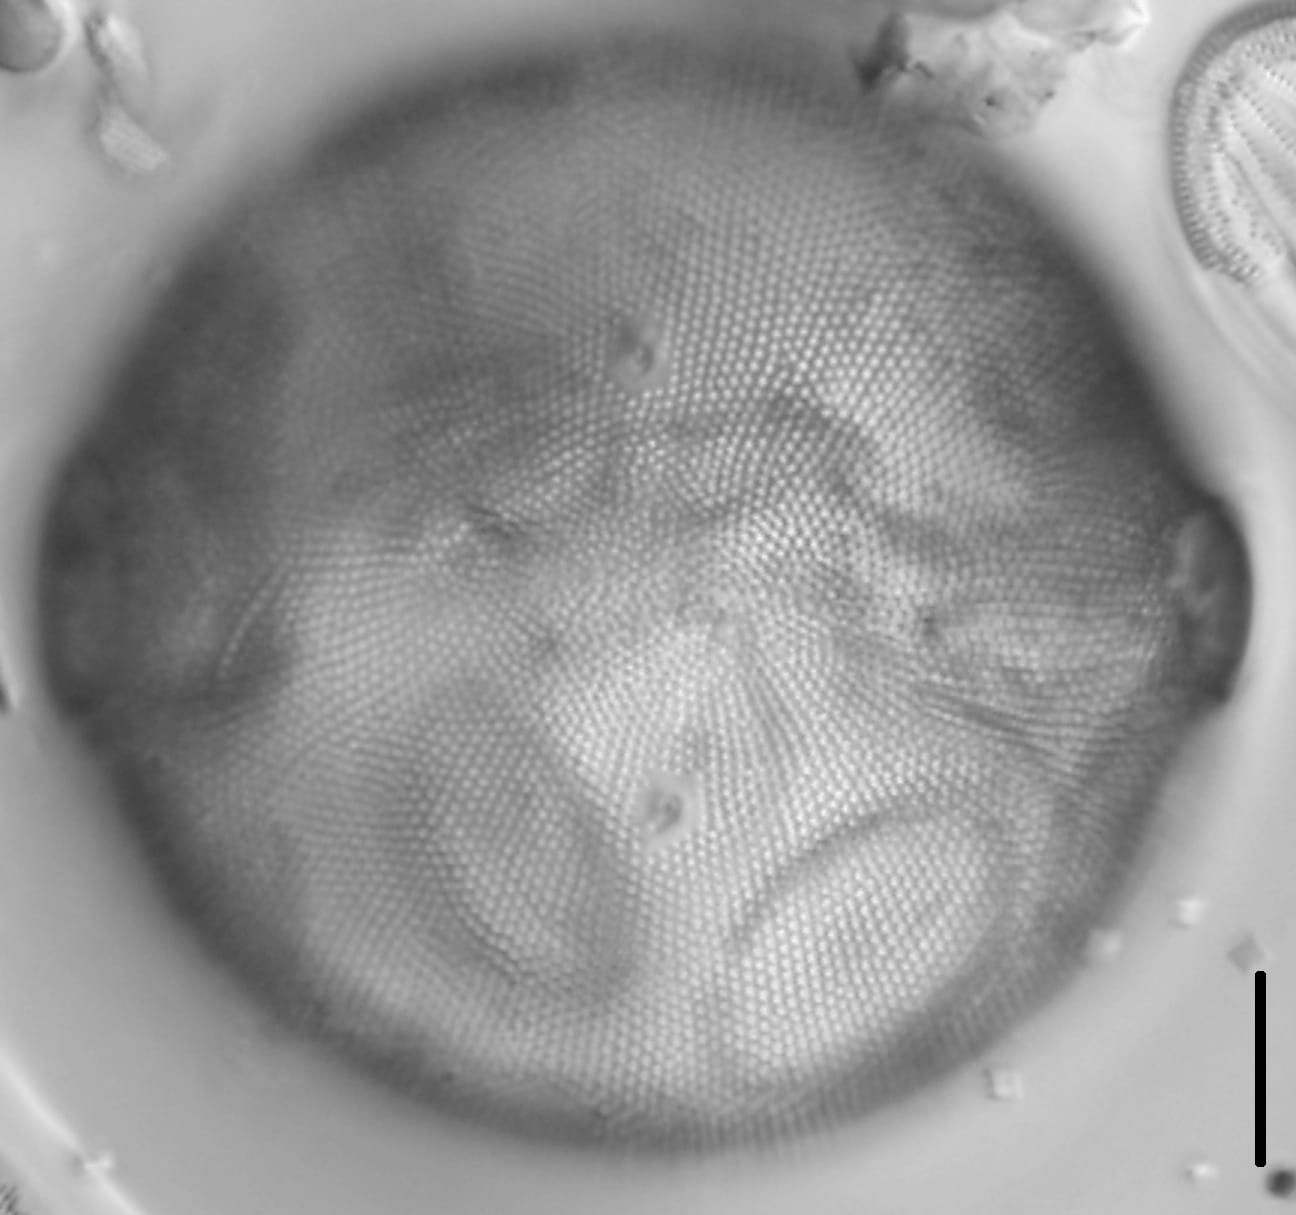
Valves circular to elliptical. The valve face is slightly hemispherical. Two ocelli are present, positioned opposite one another, composed of fine rows of porelli. The ocelli are not the same size; one is much larger than the other. Two-three rimoportulae are present, each with a small, hyaline area surrounding the opening. Striae are radiate and number 12-13 in 10 μm at margin of valve face. Areolae are in short radial rows at the valve margin, irregularly arranged in central part of valve. Areola density is 12-18 in 10 μm. Spinules are present across valve face and at the margin.
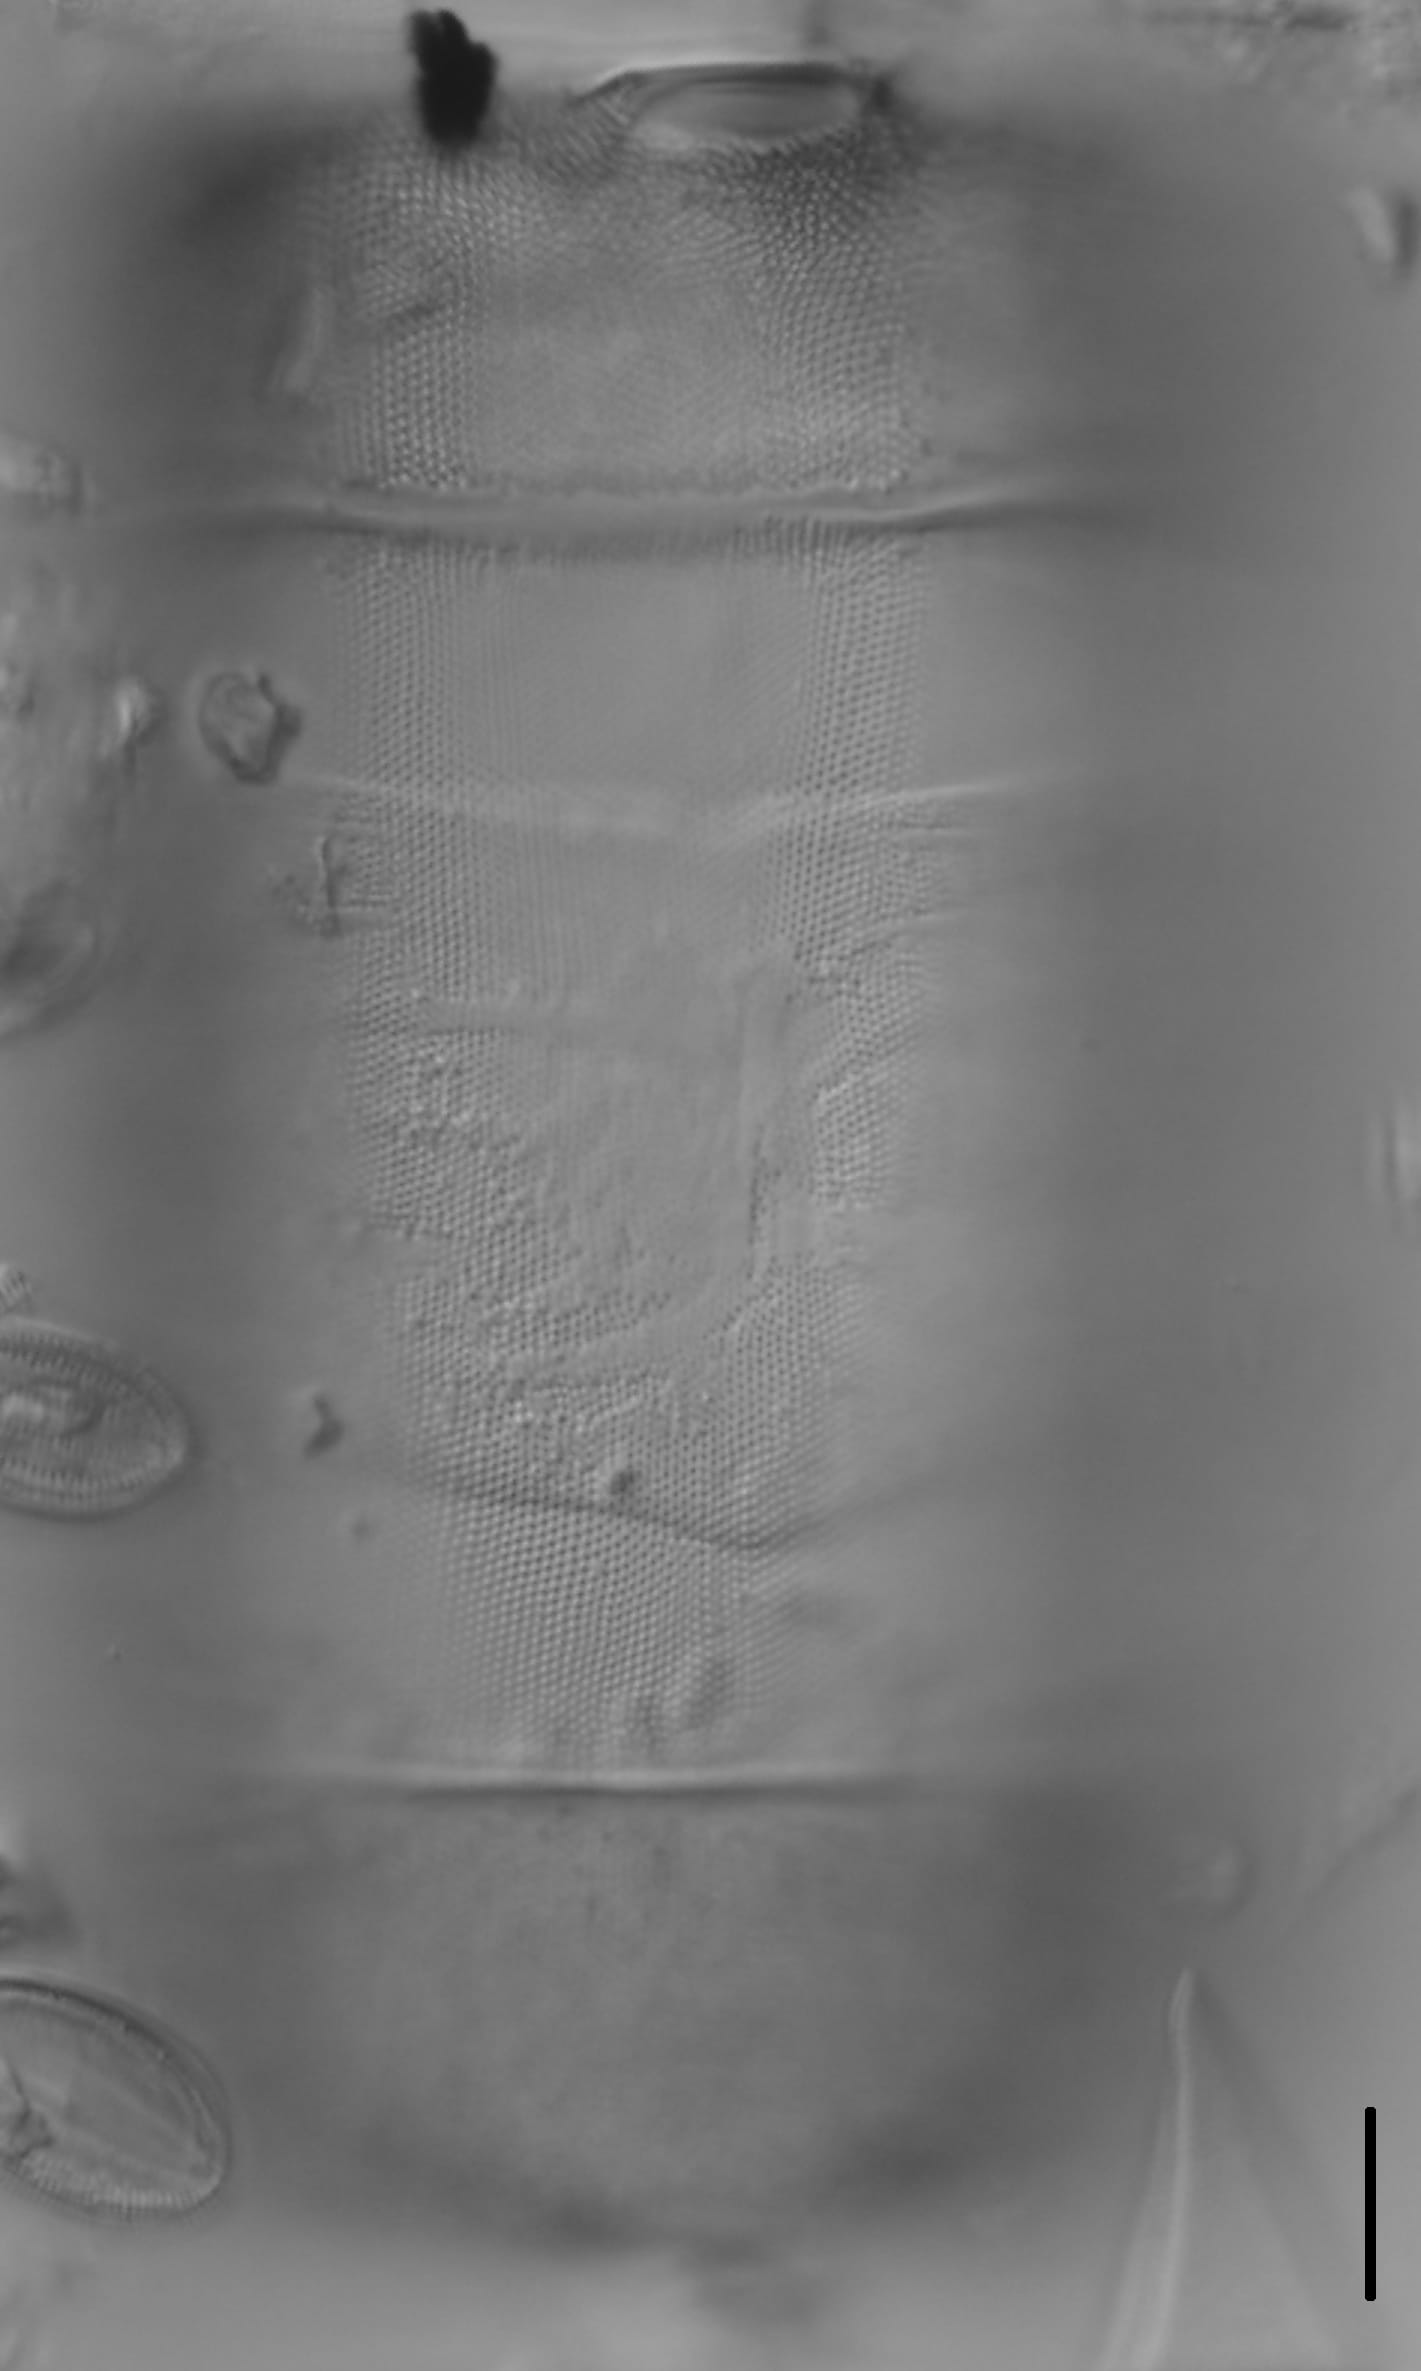
Living cells are joined in zig-zag chains, with cells attached to one another by mucilage at the opposing cell's ocelli.
Kociolek et al. (1983) reported this species from inland habitats in Ohio, and a related species was recently described from India (Karthick and Kociolek 2011). Images from Krammer and Lange-Bertalot (1991) are more similar to those depicted here (from California) than the images from Kociolek et al. More research is needed to clarify the relationships of these populations.
A small mother cell (left) and auxospore of Pleurosira laevis. The auxospore is 121 µm in length. Cells are from the Caloosahatchee River, Fort Myers, Florida (Lat: 26.6582, Long: -81.8532).
Credit: Emily Nodine
A group of cells of Pleurosira laevis in girdle view, along with an auxospore in valve view. The auxospore is 129 µm in length. Cells are from the Caloosahatchee River, Fort Myers, Florida (Lat: 26.6582, Long: -81.8532).
Kociolek, P. (2011).
Pleurosira laevis.
In Diatoms of North America.
Retrieved July 27, 2026, from https://diatoms.org/species/46437/pleurosira_laevis
Responses
The 15 response plots show an environmental variable (x axis) against the relative abundance (y axis) of Pleurosira laevis from all the stream reaches where it was present. Note that the relative abundance scale is the same on each plot. Explanation of each environmental variable and units are as follows:
ELEVATION = stream reach elevation (meters) STRAHLER = distribution plot of the Strahler Stream Order SLOPE = stream reach gradient (degrees) W1_HALL = an index that is a measure of streamside (riparian) human activity that ranges from 0 - 10, with a value of 0 indicating of minimal disturbance to a value of 10 indicating severe disturbance. PHSTVL = pH measured in a sealed syringe sample (pH units) log_COND = log concentration of specific conductivity (µS/cm) log_PTL = log concentration of total phosphorus (µg/L) log_NO3 = log concentration of nitrate (µeq/L) log_DOC = log concentration of dissolved organic carbon (mg/L) log_SIO2 = log concentration of silicon (mg/L) log_NA = log concentration of sodium (µeq/L) log_HCO3 = log concentration of the bicarbonate ion (µeq/L) EMBED = percent of the stream substrate that is embedded by sand and fine sediment log_TURBIDITY = log of turbidity, a measure of cloudiness of water, in nephelometric turbidity units (NTU). DISTOT = an index of total human disturbance in the watershed that ranges from 1 - 100, with a value of 0 indicating of minimal disturbance to a value of 100 indicating severe disturbance.
Pleurosira laevis
(Ehrenb.) Compère 1982
Ocelli 2
Rimoportulae 2-3
Valves circular to elliptical and 65–120 μm in diameter. Two ocelli positioned opposite one another. Two to three rimoportulae are present, each with a small hyaline area surrounding each. Spinules are present across valve face and at the margin.