
Credit: Courtesy of S.P. Main.
Live cell (500x) in valve view.

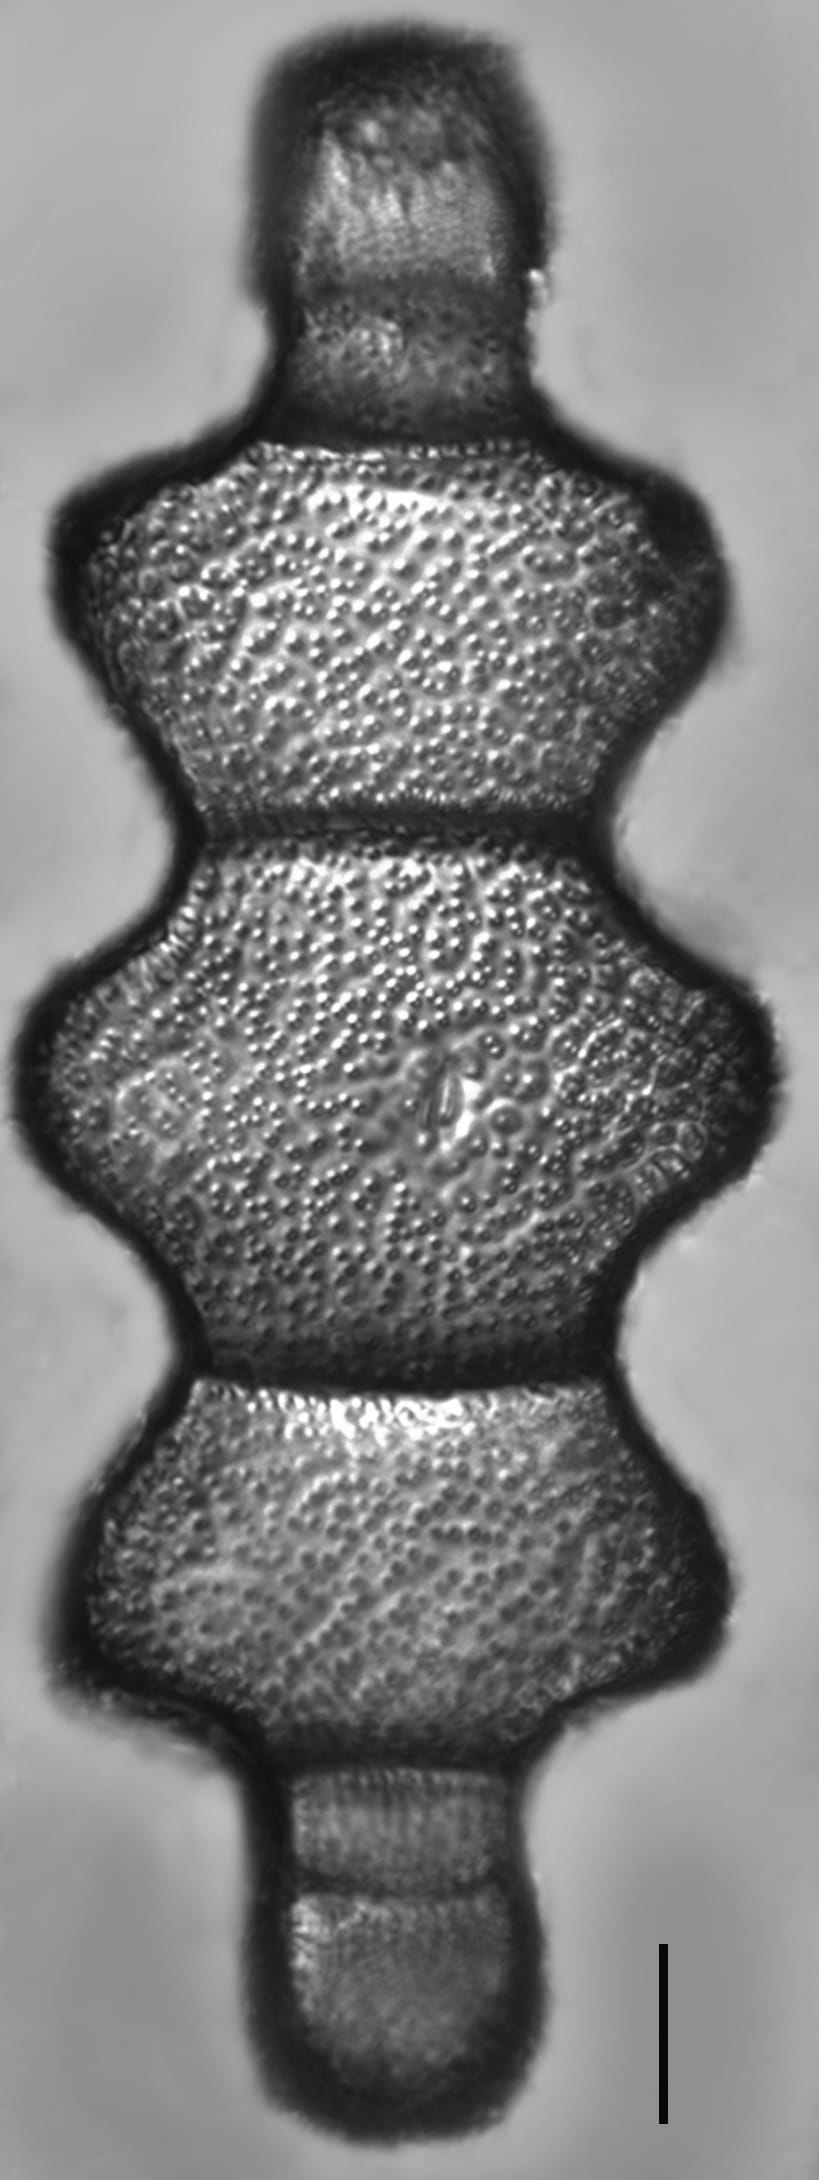
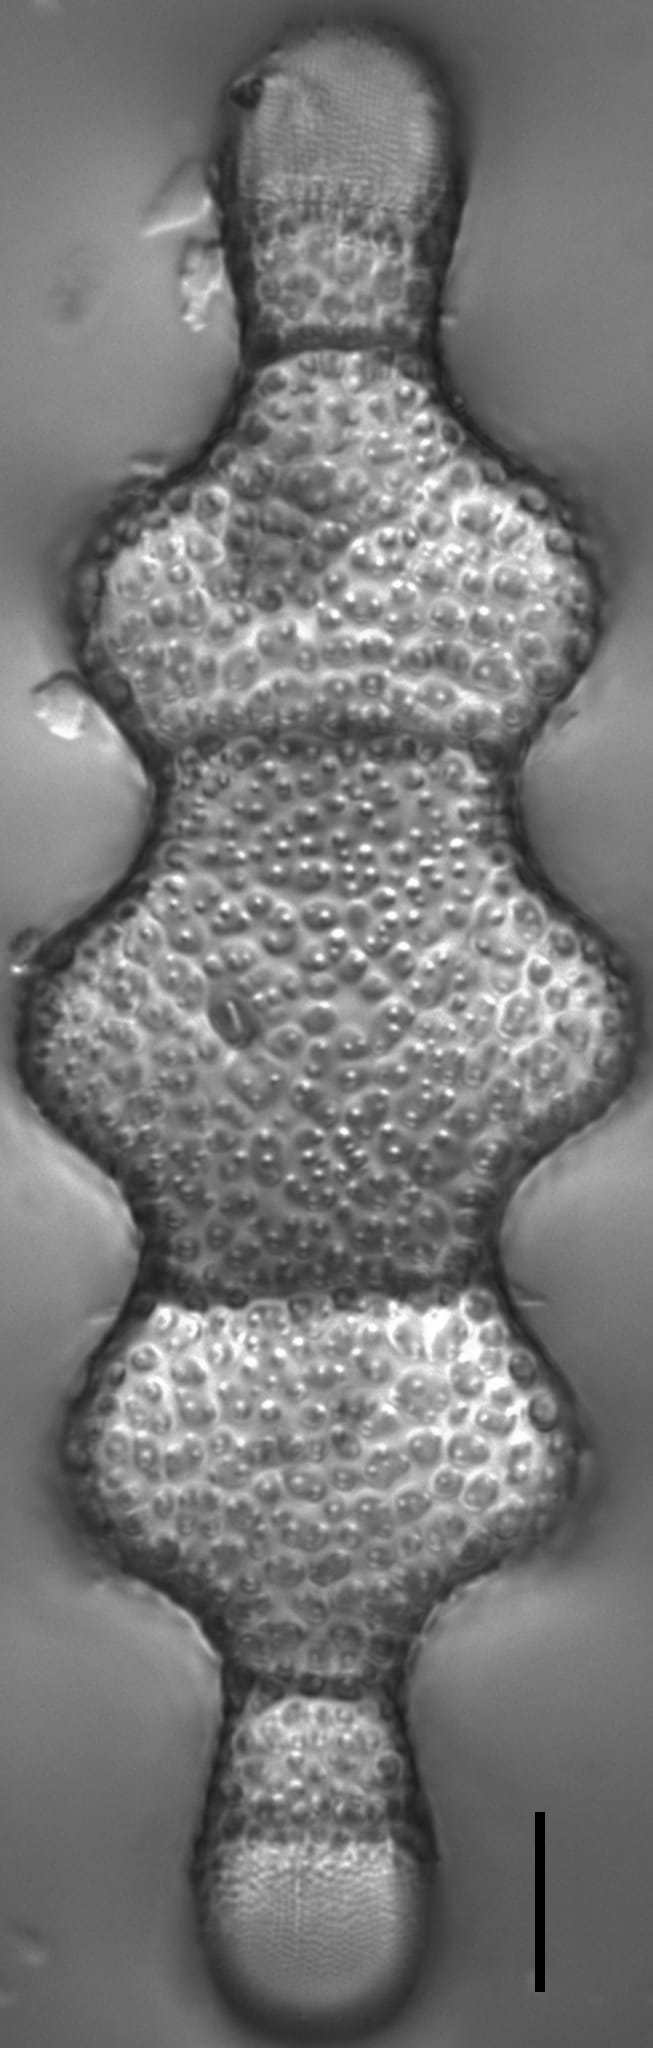
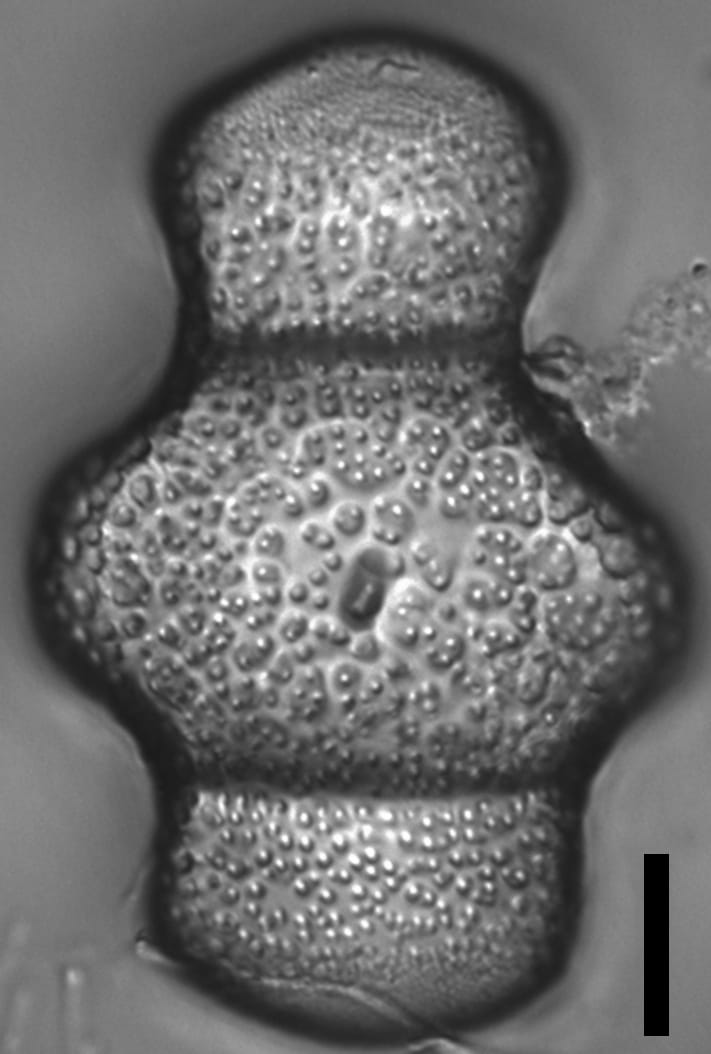
Frustules are heavily silicified. Valves are usually triundulate in valve view, with three inflations that are nearly equal in width. The number of inflations decreases with valve size, with the smallest valves possessing only one inflation. Transapical bars, or internal costae, are present between each inflation and near the valve apicies. The valve apicies are rostrate to capitate and possess pseudocelli, with fine pores arranged in apically oriented rows. The external surface of the valves are covered by irregularly shaped ridges with scattered, coarse areolae. The middle inflation contains a single rimoportula, positioned slightly off center. The valve length to breadth ratio ranges from 1.6 to 3.7.
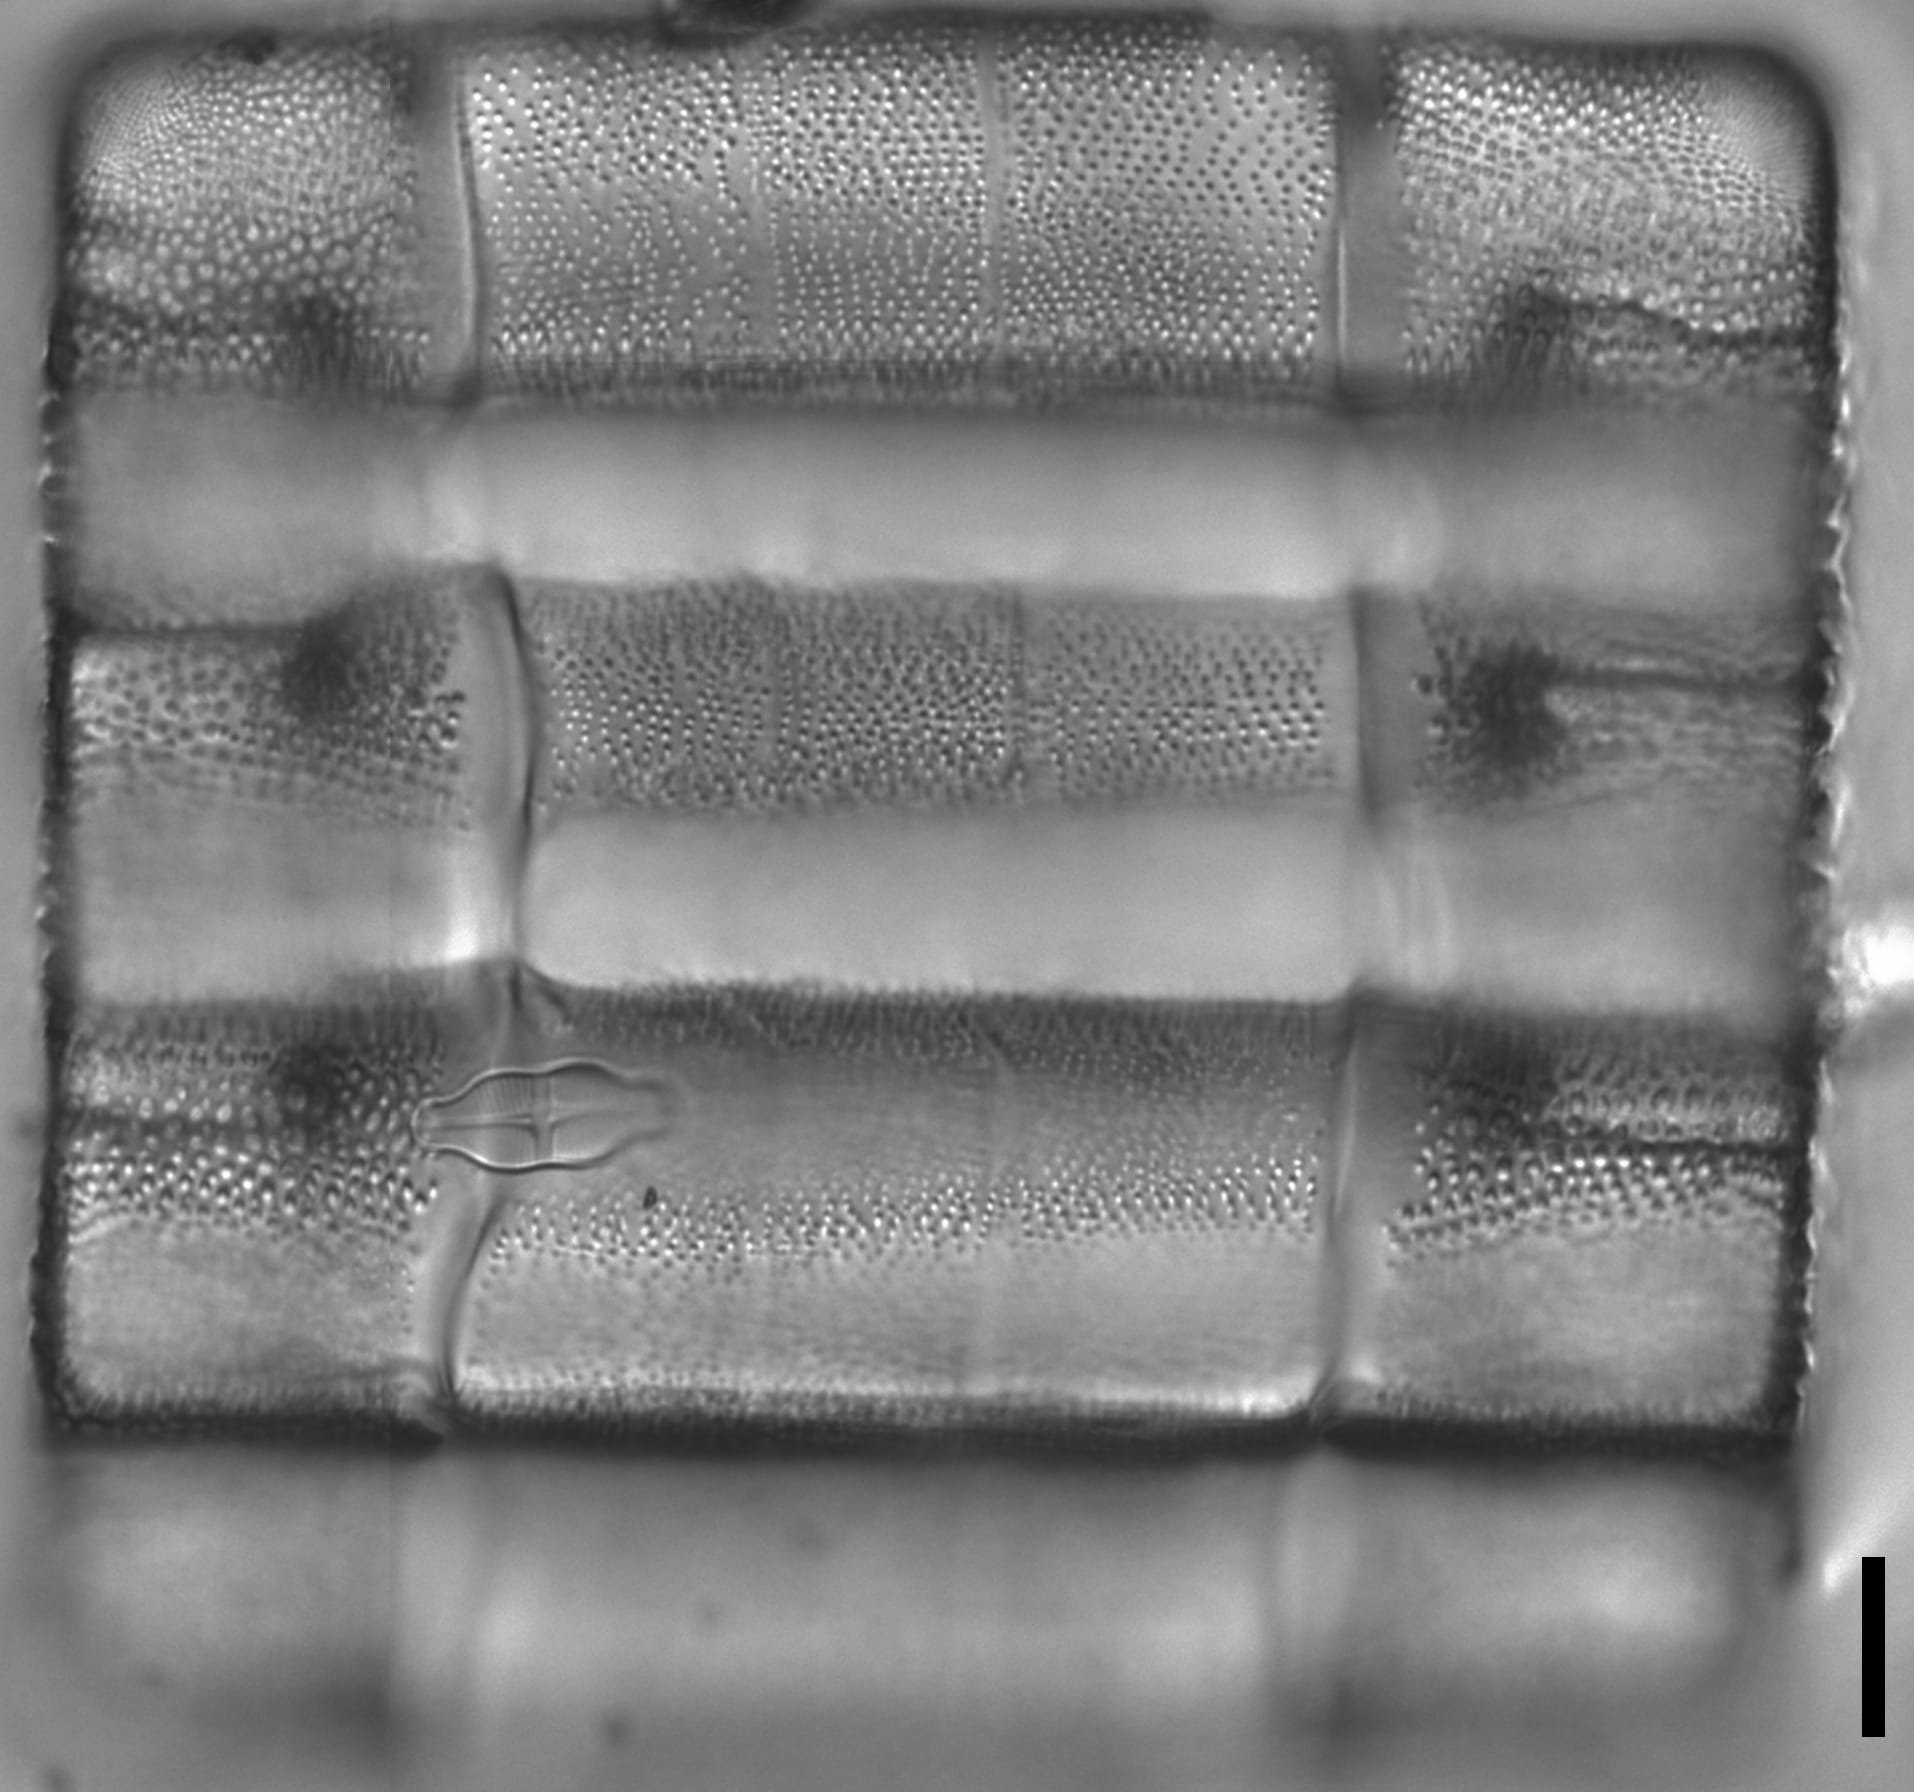
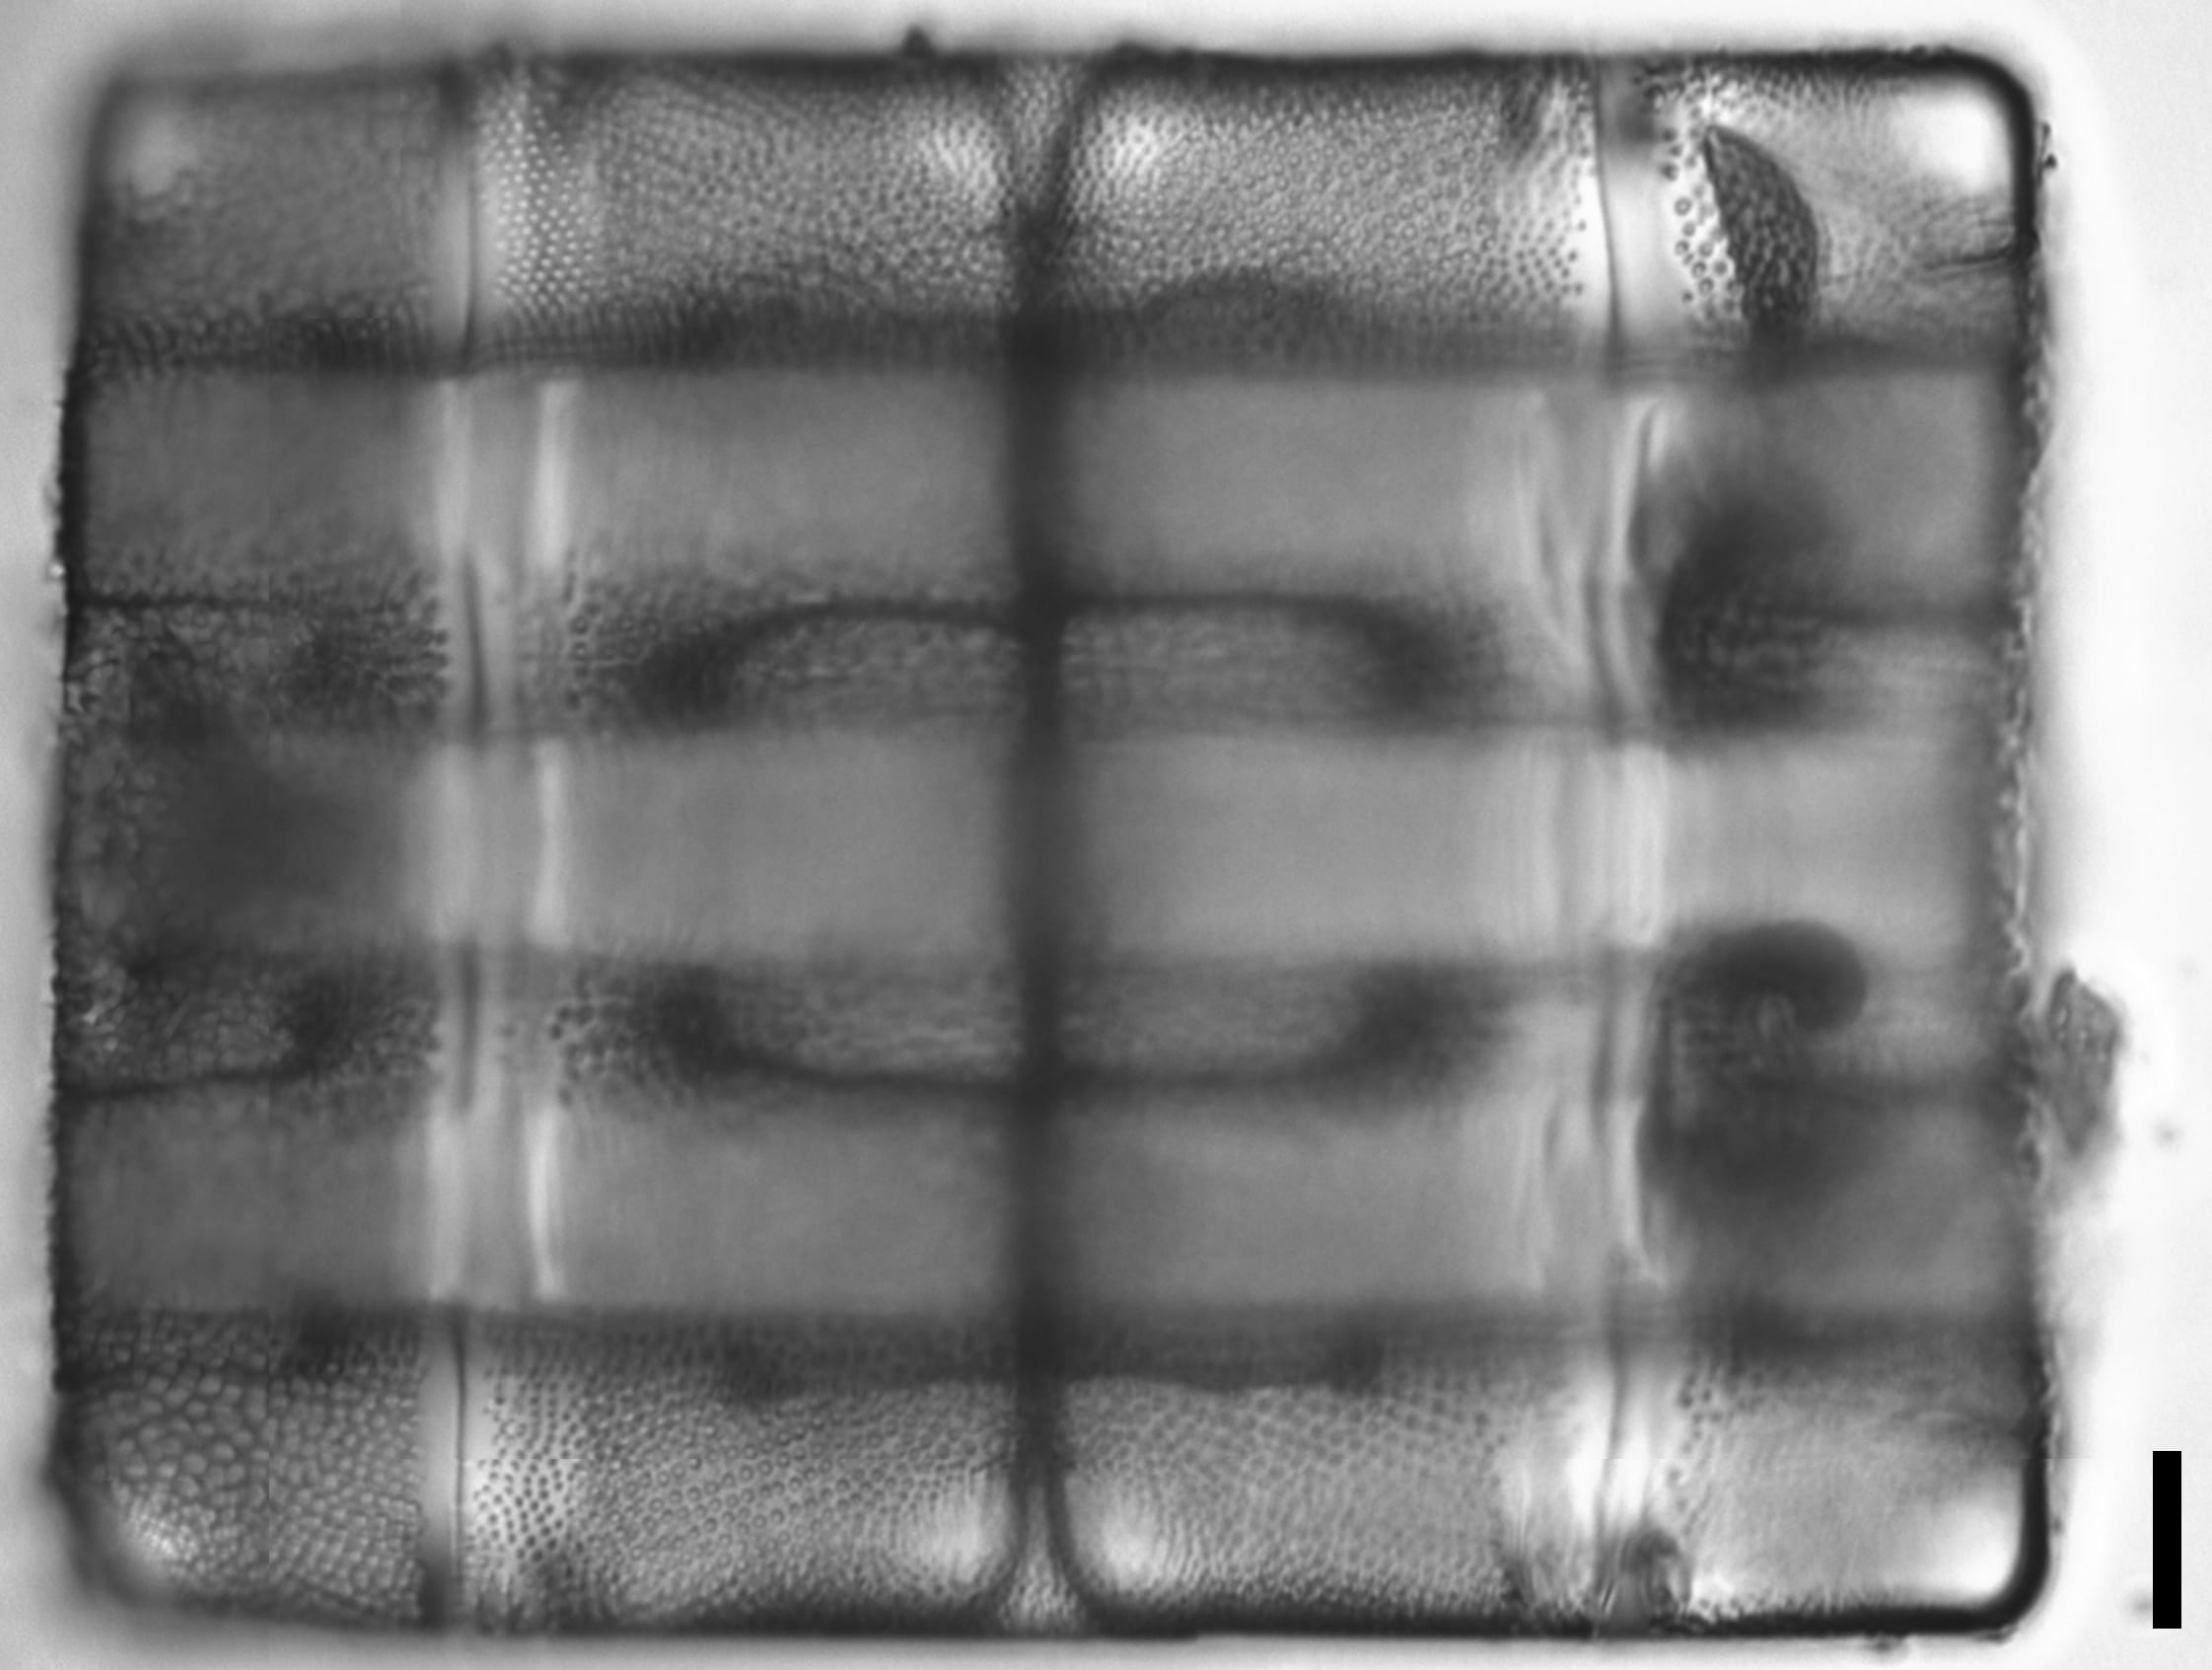
In girdle view, valves are rectangular. The silica bars between the valve inflations are distinct and appear as “musical notes”. A small pseudoseptum is present at the valve ends, near the edge of the valve mantle.
Living cells possess numerous discoid chloroplasts. Cells are linked together in colonies by mucilage secreted by the pseudocelli.
Some of the older literature uses the terms “transapical septa” or “pseudosepta” for the transapical bars.
Terpsinoë musica is widely distributed and can be found in freshwater to marine habitats (Wehr 2003). Navarro and Lobban (2009) reported T. musica at freshwater sites in Guam. El-Awamri et al. (2007) found T. musica in brackish water that was characterized as hard water in Cairo, Egypt. It has been suggested that T. musica is most frequent in hard waters with warm temperatures (Sterrenburg 1994).
The 2012 Aquatic Microbiology Class of Loyola University New Orleans collected Terpsinoë musica near the Turtle Cove Environmental Research Station in Louisiana. T. musica was identified by C.W. Reimer from plant scrapings from Comal Springs in New Braunfels, Texas (ILL-L-3-20). Luttenton et al. (1986) sampled several substrates in Cummins Spring in Oklahoma and found that T. musica was the most abundant on submerged tree branches, and was abundant on roots and aquatic bryophytes. El-Awamri et al. (2007) examined the surface of filamentous algae such as Cladophora and found specimens present in long chains, which may facilitate attachment on the substrate and resist strong flow of ground water. T. musica was predominant in the winter and frequent in the spring, summer, and autumn (El-Awamri et al. 2007).
T. musica can also be found on other substrates such as rocks. For example, a specimen by Stephen P. Main collected from the National Tropical Botanical Garden falls pool in Kauai illustrated the presence of T. musica along with Pleurosira laevis (ILL-14-10-98-2). It has been previously reported that T. musica was found with Pleurosira laevis in Lake Michigan (Wujek and Welling 1981). Although T. musica is often attached to a substrate, O'Farrell (1994) found T. musica as one of the abundant phytoplankton species in Uruguay River tributaries.
A forensic study assessing algal colonization on hair submerged near Lake Ponchartrain found the presence of T. musica and P. laevis on natural hair and synthetic hair for at least two weeks of submergence (Unpublished data, S. Wu's personal observation).


Wu, S. (2013). Terpsinoë musica. In Diatoms of North America. Retrieved May 19, 2026, from https://diatoms.org/species/49374/terpsinoe_musica
The 15 response plots show an environmental variable (x axis) against the relative abundance (y axis) of Terpsinoë musica from all the stream reaches where it was present. Note that the relative abundance scale is the same on each plot. Explanation of each environmental variable and units are as follows:
ELEVATION = stream reach elevation (meters)
STRAHLER = distribution plot of the Strahler Stream Order
SLOPE = stream reach gradient (degrees)
W1_HALL = an index that is a measure of streamside (riparian) human activity that ranges from 0 - 10, with a value of 0 indicating of minimal disturbance to a value of 10 indicating severe disturbance.
PHSTVL = pH measured in a sealed syringe sample (pH units)
log_COND = log concentration of specific conductivity (µS/cm)
log_PTL = log concentration of total phosphorus (µg/L)
log_NO3 = log concentration of nitrate (µeq/L)
log_DOC = log concentration of dissolved organic carbon (mg/L)
log_SIO2 = log concentration of silicon (mg/L)
log_NA = log concentration of sodium (µeq/L)
log_HCO3 = log concentration of the bicarbonate ion (µeq/L)
EMBED = percent of the stream substrate that is embedded by sand and fine sediment
log_TURBIDITY = log of turbidity, a measure of cloudiness of water, in nephelometric turbidity units (NTU).
DISTOT = an index of total human disturbance in the watershed that ranges from 1 - 100, with a value of 0 indicating of minimal disturbance to a value of 100 indicating severe disturbance.