Encyonopsis subminuta

-
Category
-
Length Range10-15 µm
-
Width Range3-4 µm
-
Striae in 10 µm23-27
-
Contributor
-
ReviewerSam Rushforth - Jul 2011
Identification
Description
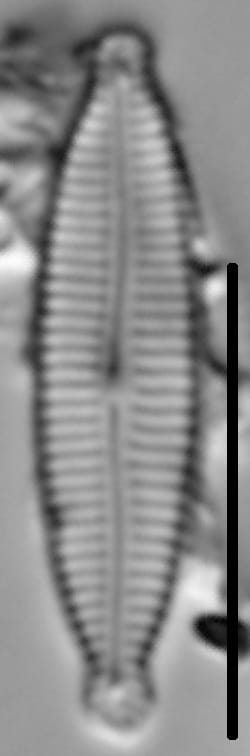
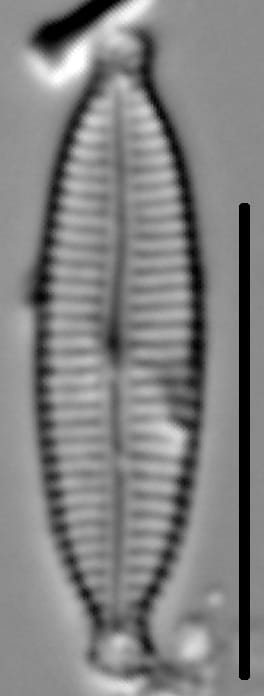
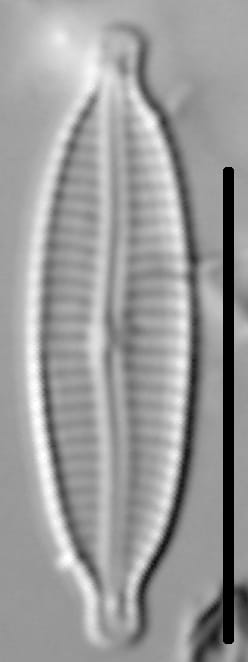
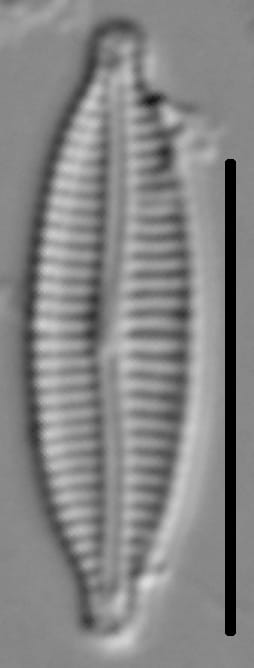
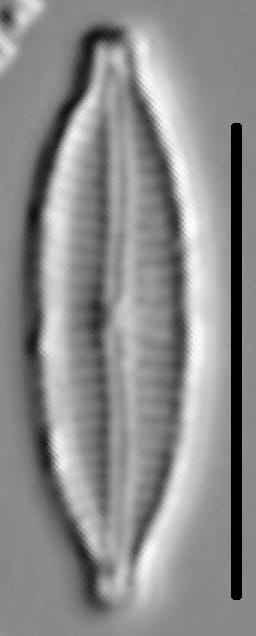
Valves are slightly asymmetrical to the apical axis, with both the dorsal and ventral margins slightly convex. The apices are protracted, relatively narrow and short. The axial area is very narrow, linear. A central area is absent. The raphe is slightly arched, filiform, with external proximal ends dilated slightly. Striae are radiate to nearly parallel.
Autecology
This taxon has been reported with light micrographs from the Rocky mountains, Great Plains, Cascades, Coast Ranges, Sierras, and the California Imperial Valley (Bahls 2021).
In the Great Lakes National Parks (Edlund et al. 2009, 2011, 2012, 2013), this taxon is common (5-25% abundance) in sediment core material from Sleeping Bear Dunes (Florence and Bass lakes), and uncommon (1-5% abundance) to rare (0.1-1% abundance) at Pictured Rocks (Beaver Lake) and Voyageurs (Cruiser, Little Trout, Mukooda, Ek, Locator, Ryan and Brown lakes).
This taxon is reported to occur in rivers, creeks and lakes, with a preference for montane habitats (Bahls 2021). It prefers cool, alkaline waters with moderate conductivity and nutrient content (Bahls 2021).
Several research groups consider this taxon an indicator organism and published regional environmental optima and tolerances including:
Bahls (2021): Conductivity - 389 µS/cm, pH - 8.0, Temperature - 16.4°C, Total Nitrogen - 0.38 mg/L, Total Phosphorus - 33 µg/L for populations from Northwestern North America.
-
Size Range, µm3
-
Motility
-
Attachment
-
Habitat
-
Colony
-
BCG
-
Waterbody
-
Distribution
- Learn more about this
Original Description
-
AuthorKrammer and E.Reichardt 1997
-
Length Range10-26 µm
-
Width3.4-4.5 µm
-
Striae in 10µm23-26
Original Images


Citations & Links
Citations
-
Publication Link: 10.1007/s10933-008-9296-1
Links
-
Index Nominum Algarum
-
North American Diatom Ecological DatabaseNADED ID: 203008
Updates
Feb 11, 2026 - Addition to Autecology
From 2011 to until 2026, the autecological information on this taxon page was limited. As of this update, information on ecology, biogeography, and environmental optima have been added. - Lane Allen and Mark Edlund
Cite This Page
Kociolek, P., Edlund, M., Allen, L. (2011). Encyonopsis subminuta. In Diatoms of North America. Retrieved July 22, 2026, from https://diatoms.org/species/46361/encyonopsis_subminuta
Responses
The 15 response plots show an environmental variable (x axis) against the relative abundance (y axis) of Encyonopsis subminuta from all the stream reaches where it was present. Note that the relative abundance scale is the same on each plot. Explanation of each environmental variable and units are as follows:
ELEVATION = stream reach elevation (meters)
STRAHLER = distribution plot of the Strahler Stream Order
SLOPE = stream reach gradient (degrees)
W1_HALL = an index that is a measure of streamside (riparian) human activity that ranges from 0 - 10, with a value of 0 indicating of minimal disturbance to a value of 10 indicating severe disturbance.
PHSTVL = pH measured in a sealed syringe sample (pH units)
log_COND = log concentration of specific conductivity (µS/cm)
log_PTL = log concentration of total phosphorus (µg/L)
log_NO3 = log concentration of nitrate (µeq/L)
log_DOC = log concentration of dissolved organic carbon (mg/L)
log_SIO2 = log concentration of silicon (mg/L)
log_NA = log concentration of sodium (µeq/L)
log_HCO3 = log concentration of the bicarbonate ion (µeq/L)
EMBED = percent of the stream substrate that is embedded by sand and fine sediment
log_TURBIDITY = log of turbidity, a measure of cloudiness of water, in nephelometric turbidity units (NTU).
DISTOT = an index of total human disturbance in the watershed that ranges from 1 - 100, with a value of 0 indicating of minimal disturbance to a value of 100 indicating severe disturbance.
Encyonopsis subminuta
- Valves slightly asymmetrical to the apical axis
- Apices protracted
- Axial area very narrow
- Central area absent
Valves 10-15 µm long by 3-4 µm wide, slightly asymmetrical to the apical axis. Apices are protracted, relatively narrow and short. The axial area is very narrow and linear and the central area is absent. Striae are radiate to nearly parallel.