
Credit: Loren Bahls
Kootenai Pond, Glacier National Park, Montana: home of Encyonopsis falaisensis and Encyonopsis cesatii.

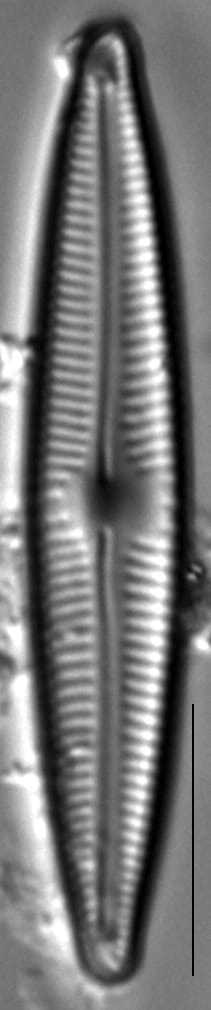
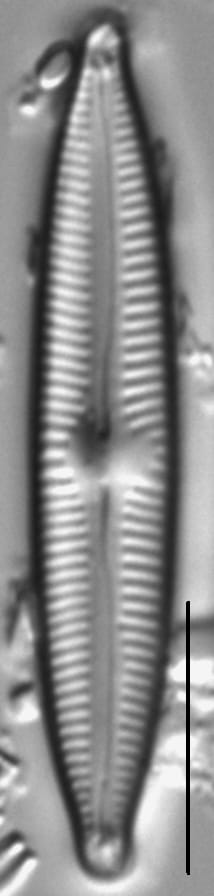
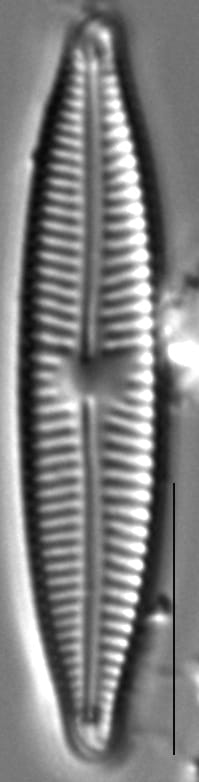
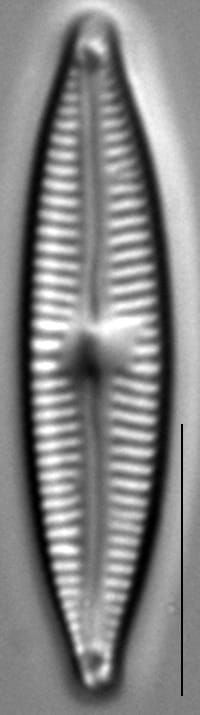
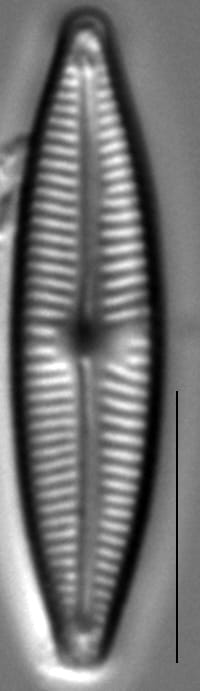
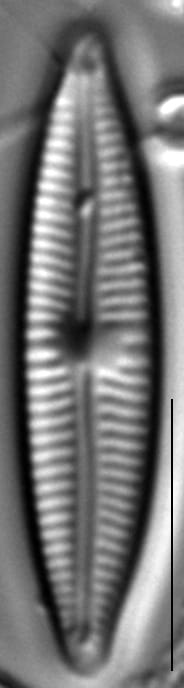
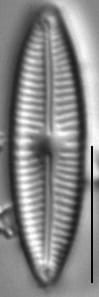
Valves are lanceolate to linear-lanceolate and nearly symmetric with respect to the apical axis. Apices are short and subrostrate. The axial area is narrow. The central area is rounded, moderately large, and somewhat asymmetric. The raphe is lateral. Proximal raphe ends are deflected toward the dorsal side. Terminal raphe ends are hooked toward the ventral side. Striae are radiate throughout. Areolae are very fine and difficult to resolve in LM.
Encyonopsis falaisensis is common in small headwater lakes, ponds and springs in the northern Rocky Mountains, where it may be associated with E. cesatii. These waters tend to be cold, somewhat alakaline, and with low to moderate levels of dissolved solids. Krammer & Lange-Bertalot (1986) report this species as common in oligotrophic waters of northern Europe and in the mountains of middle Europe.

Bahls, L. (2013). Encyonopsis falaisensis. In Diatoms of North America. Retrieved April 03, 2026, from https://diatoms.org/species/49057/encyonopsis_falaisensis
The 15 response plots show an environmental variable (x axis) against the relative abundance (y axis) of Encyonopsis falaisensis from all the stream reaches where it was present. Note that the relative abundance scale is the same on each plot. Explanation of each environmental variable and units are as follows:
ELEVATION = stream reach elevation (meters)
STRAHLER = distribution plot of the Strahler Stream Order
SLOPE = stream reach gradient (degrees)
W1_HALL = an index that is a measure of streamside (riparian) human activity that ranges from 0 - 10, with a value of 0 indicating of minimal disturbance to a value of 10 indicating severe disturbance.
PHSTVL = pH measured in a sealed syringe sample (pH units)
log_COND = log concentration of specific conductivity (µS/cm)
log_PTL = log concentration of total phosphorus (µg/L)
log_NO3 = log concentration of nitrate (µeq/L)
log_DOC = log concentration of dissolved organic carbon (mg/L)
log_SIO2 = log concentration of silicon (mg/L)
log_NA = log concentration of sodium (µeq/L)
log_HCO3 = log concentration of the bicarbonate ion (µeq/L)
EMBED = percent of the stream substrate that is embedded by sand and fine sediment
log_TURBIDITY = log of turbidity, a measure of cloudiness of water, in nephelometric turbidity units (NTU).
DISTOT = an index of total human disturbance in the watershed that ranges from 1 - 100, with a value of 0 indicating of minimal disturbance to a value of 100 indicating severe disturbance.