Karayevia clevei

-
Category
-
Length Range10-28 µm
-
Width Range5.0-8.2 µm
-
Striae in 10 µm9-12 on rapheless valve, 18-24 on raphe valve
-
Contributor
-
ReviewerRex Lowe - Feb 2011
Identification


Description
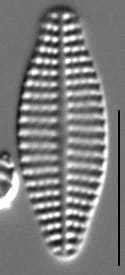
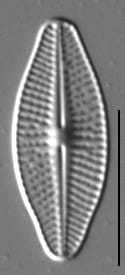
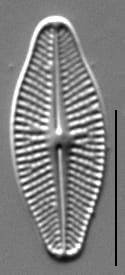
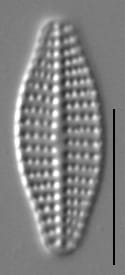
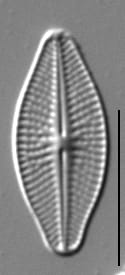
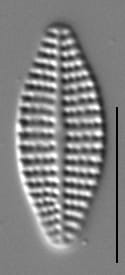
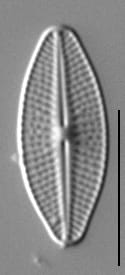
Valves are lanceolate with rounded to subrostrate apices. The raphe valve has a narrowly lanceolate axial area and no distinct central area. The raphe is straight, with terminal fissures deflected to the same side. The proximal raphe ends are slightly expanded externally. The proximal raphe ends are deflected toward opposite sides internally. Striae on raphe valve are radiate, 18-24 in 10 µm. Shortened marginal striae are often present in the middle part of the raphe valve. The areolae openings are transapical slits. The rapheless valve has a narrow linear axial area and no central area. Striae on rapheless valve are coarsely punctate, parallel in the center and slightly radiate at apices, 9-12 in 10 µm. The openings of the areolae are transapically elliptical.
Autecology
This taxon has been reported with light micrographs from the Rocky Mountains, Great Plains, Cascades, Coast Ranges and Sierras (Bahls 2021).
In the Great Lakes National Parks (Edlund et al. 2009, 2011, 2012, 2013), this taxon is uncommon (1-5% abundance) in sediment core material from Isle Royale (Richie and Ahmik lakes), Pictured Rocks (Grand Sable and Beaver lakes), Voyageurs (Mukooda Lake), and St. Croix Scenic Riverway (Lake St. Croix), and rare (0.1-1% abundance) at Sleeping Bear Dunes (Manitou Lake).
This taxon is known to occur in lakes, mountain rivers and creeks with cool alkaline waters of moderate conductivity and nutrient content (Patrick and Reimer 1966, Bahls 2021).
Several research groups consider this taxon an indicator organism and published regional environmental optima and tolerances including:
Bahls (2021): Conductivity - 393 µS/cm, pH - 8.0, Temperature - 17.4°C, Total Nitrogen - 0.23 mg/L, Total Phosphorus - 25 µg/L for populations from Northwestern North America.
-
Size Range, µm3
-
Motility
-
Attachment
-
Habitat
-
Colony
-
BCG
-
Waterbody
-
Distribution
- Learn more about this
Original Description
Klein, Schaalen breit lanzettlich mit stumpf vorgezogenen En-den. Querstreifen radial, in der Unterschaale 18—24, in der Oberschaale 9—11 in 0,01 mm., stark punktirt.
-
BasionymAchnanthes clevei
-
AuthorGrunow in Cleve and Grunow 1880
-
Striae in 10µm18-24 on raphe valve, 9-11 on rapheless valve
Original Images


Citations & Links
Citations
-
Publication Link: 10.1007/s10933-008-9296-1
Links
-
Index Nominum Algarum
-
North American Diatom Ecological DatabaseNADED ID: 125001
Updates
Feb 05, 2026 - Addition of Autecology
From 2010 until 2026, the autecological information on this taxon page was limited. As of this update, information on ecology, biogeography, and environmental optima have been added. - Lane Allen and Mark Edlund
Cite This Page
Potapova, M., Edlund, M., Allen, L. (2010). Karayevia clevei. In Diatoms of North America. Retrieved July 26, 2026, from https://diatoms.org/species/45005/karayevia_clevei
Responses
The 15 response plots show an environmental variable (x axis) against the relative abundance (y axis) of Karayevia clevei from all the stream reaches where it was present. Note that the relative abundance scale is the same on each plot. Explanation of each environmental variable and units are as follows:
ELEVATION = stream reach elevation (meters)
STRAHLER = distribution plot of the Strahler Stream Order
SLOPE = stream reach gradient (degrees)
W1_HALL = an index that is a measure of streamside (riparian) human activity that ranges from 0 - 10, with a value of 0 indicating of minimal disturbance to a value of 10 indicating severe disturbance.
PHSTVL = pH measured in a sealed syringe sample (pH units)
log_COND = log concentration of specific conductivity (µS/cm)
log_PTL = log concentration of total phosphorus (µg/L)
log_NO3 = log concentration of nitrate (µeq/L)
log_DOC = log concentration of dissolved organic carbon (mg/L)
log_SIO2 = log concentration of silicon (mg/L)
log_NA = log concentration of sodium (µeq/L)
log_HCO3 = log concentration of the bicarbonate ion (µeq/L)
EMBED = percent of the stream substrate that is embedded by sand and fine sediment
log_TURBIDITY = log of turbidity, a measure of cloudiness of water, in nephelometric turbidity units (NTU).
DISTOT = an index of total human disturbance in the watershed that ranges from 1 - 100, with a value of 0 indicating of minimal disturbance to a value of 100 indicating severe disturbance.
Karayevia clevei
- Valves lanceolate
- Striae more dense on raphe valve than on rapheless valve
- Striae on rapheless valve coarsely punctate, parallel
- Striae on raphe valve radiate
The raphe valve has a narrowly lanceolate axial area and no distinct central area. Striae on the raphe valve are radiate, 18-24 in 10 µm; shortened marginal striae are often present. The rapheless valve has a narrow linear axial area and no central area. Striae on the rapheless valve are coarsely punctate, parallel in the center and...