Tabellaria fenestrata

-
Category
-
Length Range39.0-83.0 µm
-
Width Range2.1-6.9 µm
-
Striae in 10 µm14-19
-
ContributorDawn DeColibus - Jun 2013
-
ReviewerRex Lowe - Aug 2013
Identification
Description
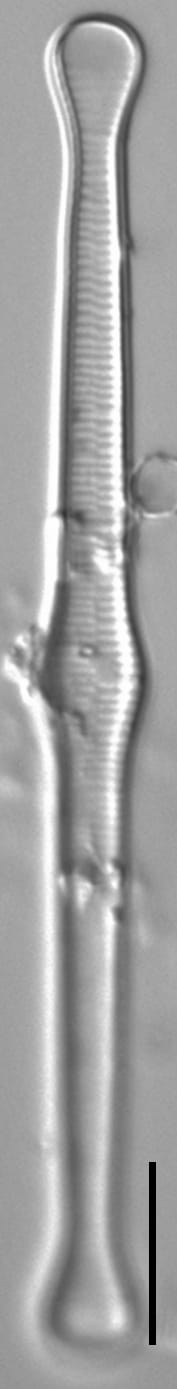
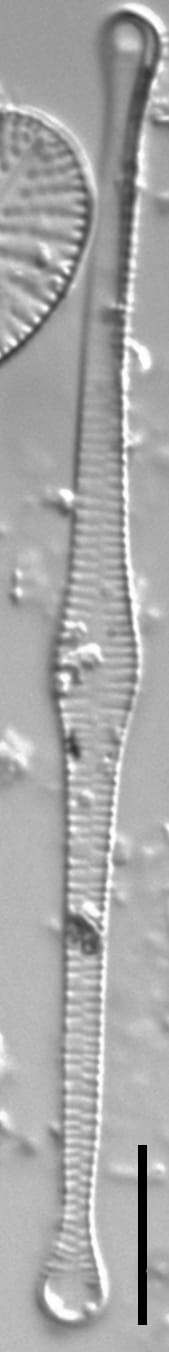
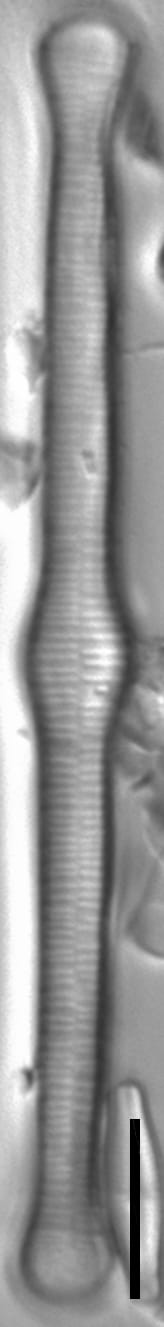
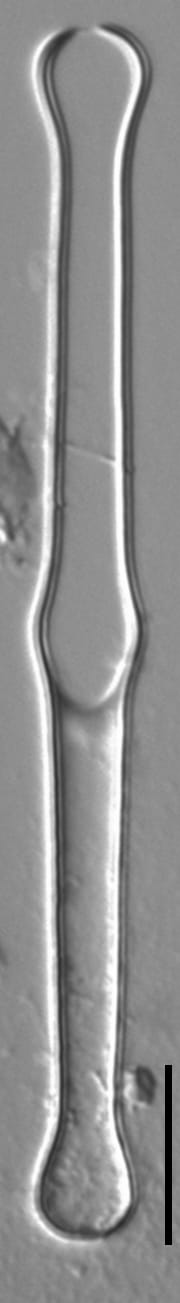
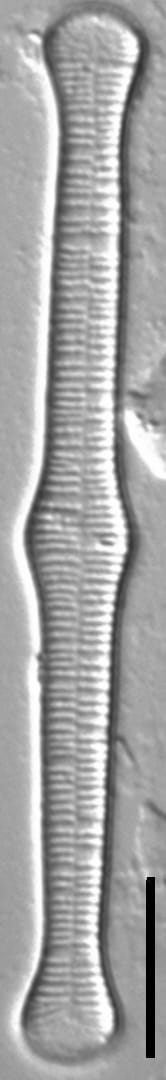
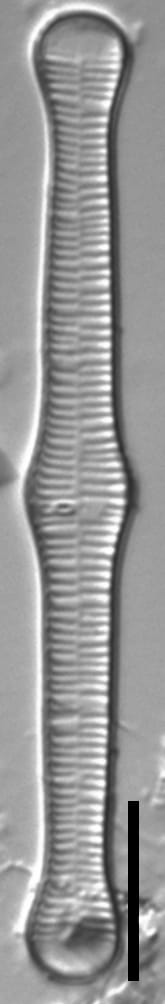
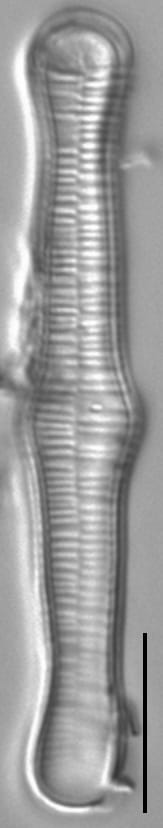
The valves are linear with a medial inflation that is as wide, or slightly wider, than the distinctly capitate apices. The striae are parallel and alternate. The axial area is narrow and linear. Striae reach the central valve. Girdle bands are open, with regular septa. Four girdle bands per frustule. One rimoportula per valve is present, usually located in, or near, the medial inflation. Rudimentary septa are absent and marginal spines are absent. The cells are joined in colonies that form long, straight chains. The frustules are rectangular in girdle view.
According to Koppen (1975), maximum valve length is 103 µm.
Autecology
Tabellaria fenestrata is usually found in circumneutral waters, especially mesotrophic-eutrophic ponds and lakes. This species can be planktonic (Krammer and Lange-Bertalot 1991) or growing attached to vegetation or other hard substrates (Knudson 1952, Koppen 1975). The colonies form long straight chains; they are rarely found in zig-zag or star-like formations (Knudson 1952, Koppen 1975).
-
Size Range, µm3
-
Motility
-
Attachment
-
Habitat
-
BCG
-
Waterbody
-
Distribution
- Learn more about this
Original Description
-
BasionymDiatoma fenestratum
-
AuthorLyngb. 1819
Original Images


Citations & Links
Citations
Links
-
Index Nominum Algarum
-
North American Diatom Ecological DatabaseNADED ID: 67002
Cite This Page
DeColibus, D. (2013). Tabellaria fenestrata. In Diatoms of North America. Retrieved July 25, 2026, from https://diatoms.org/species/49443/tabellaria_fenestrata
Responses
The 15 response plots show an environmental variable (x axis) against the relative abundance (y axis) of Tabellaria fenestrata from all the stream reaches where it was present. Note that the relative abundance scale is the same on each plot. Explanation of each environmental variable and units are as follows:
ELEVATION = stream reach elevation (meters)
STRAHLER = distribution plot of the Strahler Stream Order
SLOPE = stream reach gradient (degrees)
W1_HALL = an index that is a measure of streamside (riparian) human activity that ranges from 0 - 10, with a value of 0 indicating of minimal disturbance to a value of 10 indicating severe disturbance.
PHSTVL = pH measured in a sealed syringe sample (pH units)
log_COND = log concentration of specific conductivity (µS/cm)
log_PTL = log concentration of total phosphorus (µg/L)
log_NO3 = log concentration of nitrate (µeq/L)
log_DOC = log concentration of dissolved organic carbon (mg/L)
log_SIO2 = log concentration of silicon (mg/L)
log_NA = log concentration of sodium (µeq/L)
log_HCO3 = log concentration of the bicarbonate ion (µeq/L)
EMBED = percent of the stream substrate that is embedded by sand and fine sediment
log_TURBIDITY = log of turbidity, a measure of cloudiness of water, in nephelometric turbidity units (NTU).
DISTOT = an index of total human disturbance in the watershed that ranges from 1 - 100, with a value of 0 indicating of minimal disturbance to a value of 100 indicating severe disturbance.
Tabellaria fenestrata
- Central inflation wide
- Central striae reach axial line
- Girdle bands open
- Septae present
The central inflation is as wide, or slightly wider, than the capitate apices. Central striae reach the axial line, so there is no hyaline central area. Girdle bands open, with regular septae. Rudimentary septae are absent. Marginal spines are absent.