
Bill Williams River in western Arizona. The specimens presented here are from sample collected at this site.


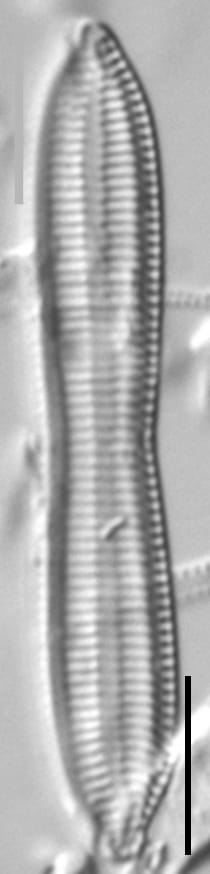
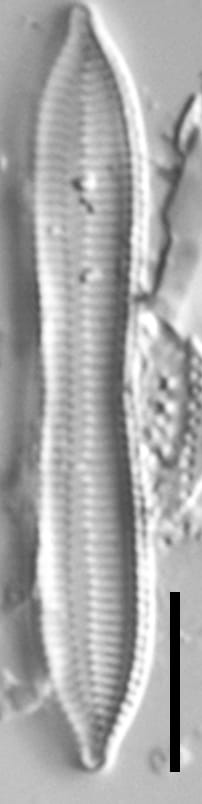
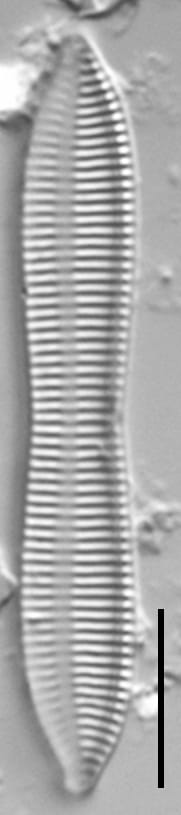
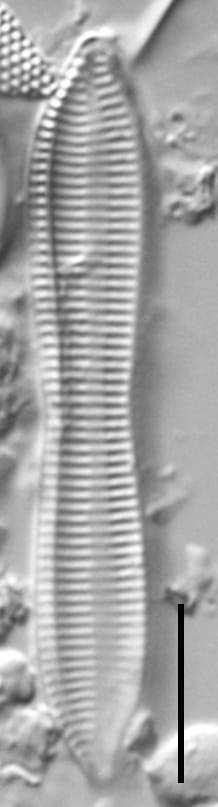
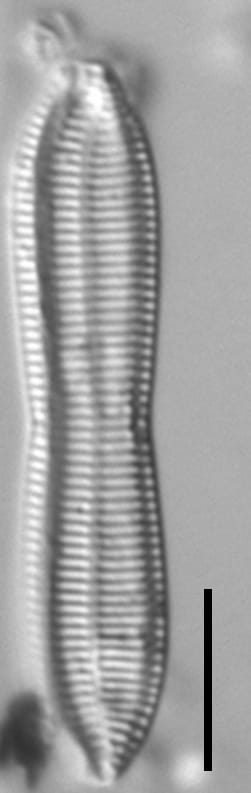
Valves are linear and constricted in the middle. The ends are expanded, so that the valves are panduriform in shape. The apices are protracted and apiculate to subcapitate. A longitudinal fold is present along the the length of the axial area. On some valves, the fold may appear to lack striae or it may have ghost striae. The ratio of striae to fibulae is 1:1, and they can be seen to align with one another. The raphe is eccentric. Although a central nodule is present, it is not always easily seen.
Krammer and Lange-Bertalot (1988, pg. 43) report species as Nitzschia constricta (Kützing) Ralfs in Pritchard 1861 non (Gregory) Grunow in Cleve and Grunow 1880. This taxon has also been referred to as Tryblionella constricta Gregory 1855 in some references. Note that Mann (1990) transferred Nitzschia constricta to Psammodictyon constrictum (Gregory) Mann, but that P. constrictum is a marine taxon quite different from T. apiculata.
Form linear, narrow, slightly constricted in the middle; extremities apiculate. Keel strongly marked in many specimens, striae fine but distinct, about 45 in 0.001”. Length 0.0015” to 0.0017”. The striation is peculiar, for in many species it is easy to see not only transverse, but oblique striae.


From 6/4/2013 until 2/27/2026, this taxon was reported as having length of 39-47 µm and a stria count of 15-17 in 10 µm. Specimens from Utah with a length of 32 and stria count of 18 in 10 µm were documented. This page is now updated to reflect a length of 32-47 and stria count of 15-18 in 10 µm. - Sarah Rushforth, Sarah Spaulding
Penton, M. (2013). Tryblionella apiculata. In Diatoms of North America. Retrieved April 03, 2026, from https://diatoms.org/species/49407/tryblionella_apiculata
The 15 response plots show an environmental variable (x axis) against the relative abundance (y axis) of Tryblionella apiculata from all the stream reaches where it was present. Note that the relative abundance scale is the same on each plot. Explanation of each environmental variable and units are as follows:
ELEVATION = stream reach elevation (meters)
STRAHLER = distribution plot of the Strahler Stream Order
SLOPE = stream reach gradient (degrees)
W1_HALL = an index that is a measure of streamside (riparian) human activity that ranges from 0 - 10, with a value of 0 indicating of minimal disturbance to a value of 10 indicating severe disturbance.
PHSTVL = pH measured in a sealed syringe sample (pH units)
log_COND = log concentration of specific conductivity (µS/cm)
log_PTL = log concentration of total phosphorus (µg/L)
log_NO3 = log concentration of nitrate (µeq/L)
log_DOC = log concentration of dissolved organic carbon (mg/L)
log_SIO2 = log concentration of silicon (mg/L)
log_NA = log concentration of sodium (µeq/L)
log_HCO3 = log concentration of the bicarbonate ion (µeq/L)
EMBED = percent of the stream substrate that is embedded by sand and fine sediment
log_TURBIDITY = log of turbidity, a measure of cloudiness of water, in nephelometric turbidity units (NTU).
DISTOT = an index of total human disturbance in the watershed that ranges from 1 - 100, with a value of 0 indicating of minimal disturbance to a value of 100 indicating severe disturbance.