
Credit: Loren Bahls
Charlie Creek, Richland County, Montana, a typical habitat of Synedra famelica

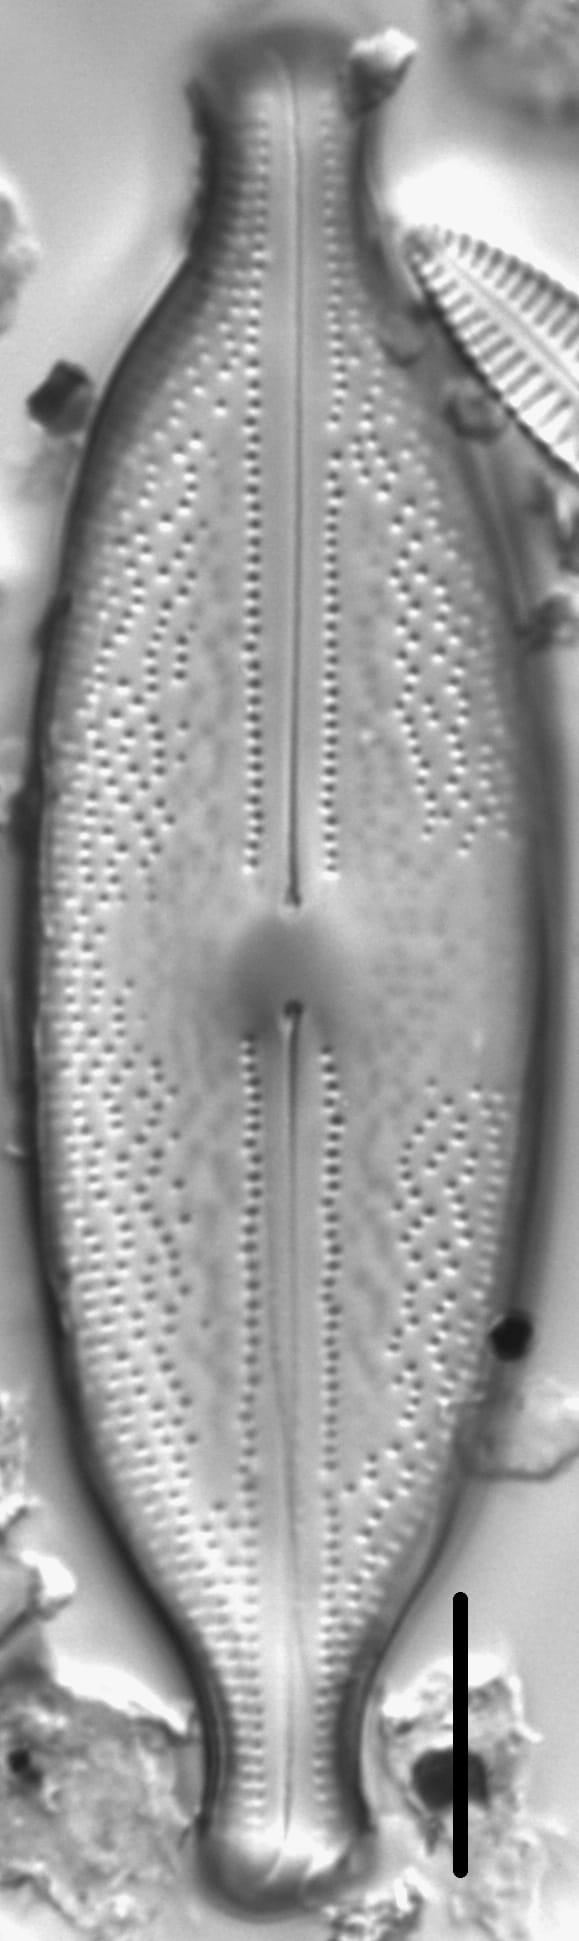
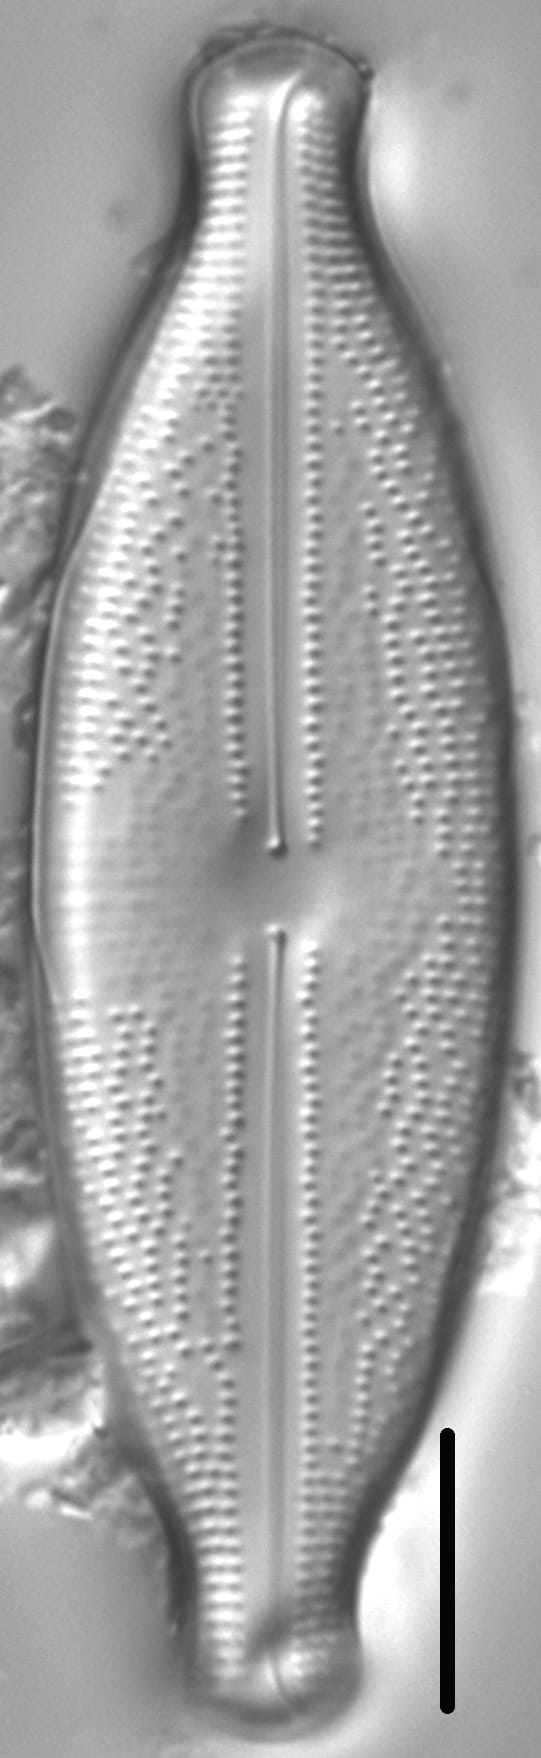
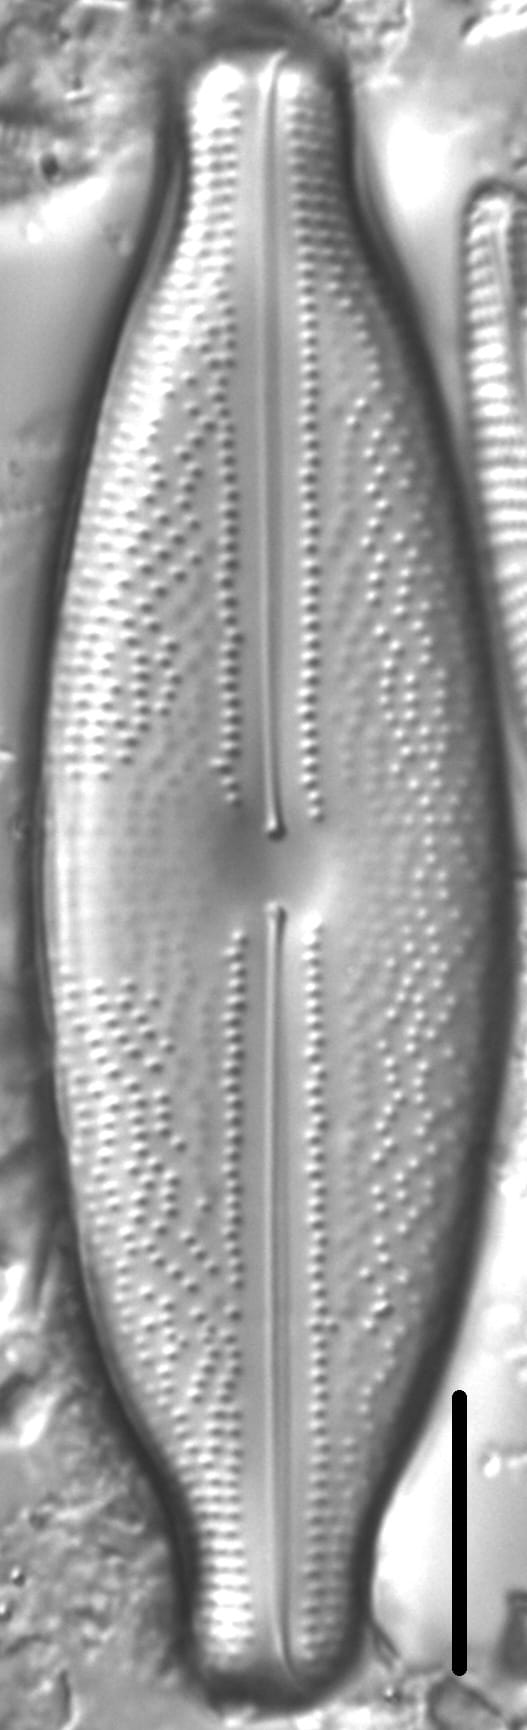
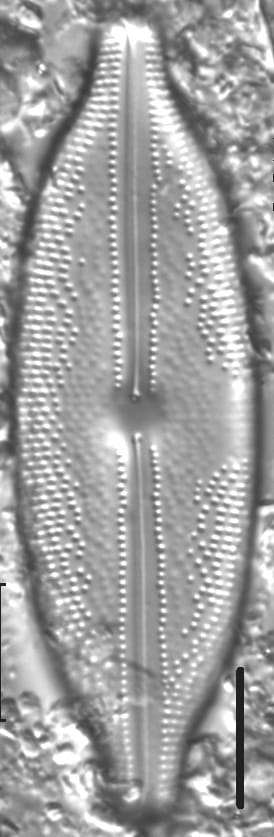
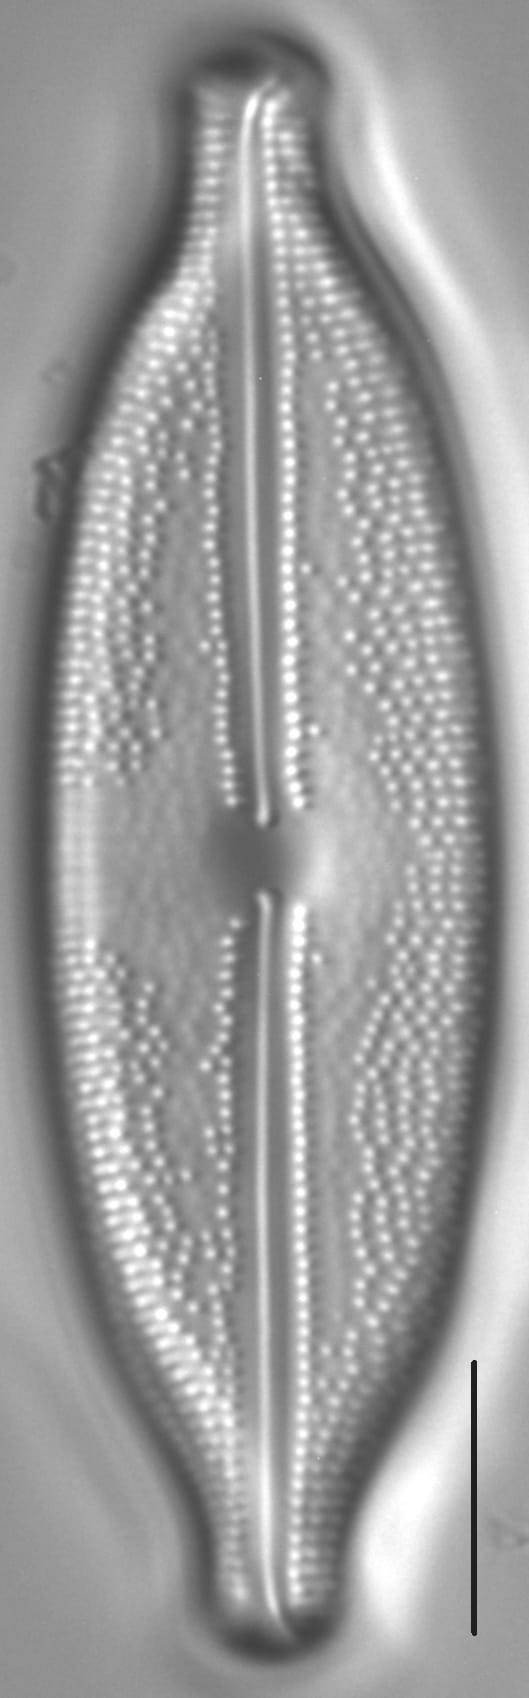
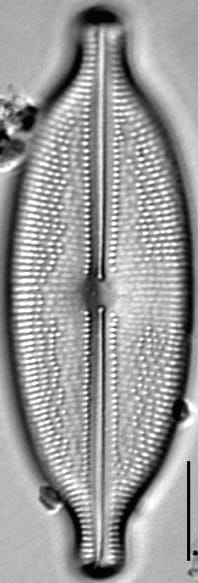
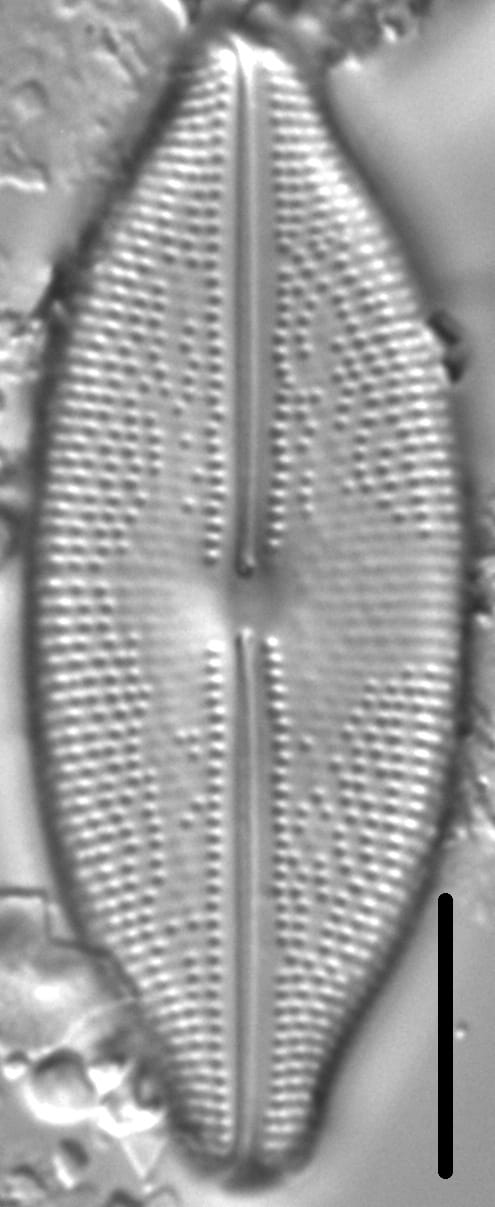
Valves are elliptic to elliptic-lanceolate, with sub-rostrate to capitate apices. The axial area is narrow and bordered on each side by a single row of areolae. Lateral spacing of areolae is variable, except near the valve margin. The central area is asymmetric and lyrate, reaching the valve margin on one side and broadly rounded on the opposite side. The central area has faint ghost striae. The raphe is lateral and straight. Proximal raphe ends are slightly inflated and bent to one side. Distal raphe fissures are deflected sharply in the same direction. Striae are radiate, becoming parallel or slightly convergent at the apices.
There are many varieties and forms of A. sphaerophora reported in the literature. Some of these may be ecological variants of the nominate variety. Others are treated here as separate species. For example, A. costata and A. sculpta are presented at the species rank.
Anomoeoneis sphaerophora is widely distributed in prairie streams, fens and shallow lakes in eastern Montana, but seldom found in abundance. These waters typically have alkaline pH and elevated levels of dissolved and suspended solids. Abundance-weighted means of selected chemical and physical variables associated with Montana collections of this species are given below.
Anomoeoneis sphaerophora is also found in Beck’s canal, West Lake Okoboji, Iowa, growing on Utricularia and on muddy surfaces in Little Miller’s Bay. Anomoeoneis sphaerophora may also be found in streams, ponds, lakes and intermittent pools. According to Patrick and Reimer (1966), it is often found in inland waters with some salinity.


Bahls, L., Morgan, L., Bishop, I., Edlund, M. (2018). Anomoeoneis sphaerophora. In Diatoms of North America. Retrieved June 04, 2026, from https://diatoms.org/species/94074/anomoeoneis-sphaerophora
The 15 response plots show an environmental variable (x axis) against the relative abundance (y axis) of Anomoeoneis sphaerophora from all the stream reaches where it was present. Note that the relative abundance scale is the same on each plot. Explanation of each environmental variable and units are as follows:
ELEVATION = stream reach elevation (meters)
STRAHLER = distribution plot of the Strahler Stream Order
SLOPE = stream reach gradient (degrees)
W1_HALL = an index that is a measure of streamside (riparian) human activity that ranges from 0 - 10, with a value of 0 indicating of minimal disturbance to a value of 10 indicating severe disturbance.
PHSTVL = pH measured in a sealed syringe sample (pH units)
log_COND = log concentration of specific conductivity (µS/cm)
log_PTL = log concentration of total phosphorus (µg/L)
log_NO3 = log concentration of nitrate (µeq/L)
log_DOC = log concentration of dissolved organic carbon (mg/L)
log_SIO2 = log concentration of silicon (mg/L)
log_NA = log concentration of sodium (µeq/L)
log_HCO3 = log concentration of the bicarbonate ion (µeq/L)
EMBED = percent of the stream substrate that is embedded by sand and fine sediment
log_TURBIDITY = log of turbidity, a measure of cloudiness of water, in nephelometric turbidity units (NTU).
DISTOT = an index of total human disturbance in the watershed that ranges from 1 - 100, with a value of 0 indicating of minimal disturbance to a value of 100 indicating severe disturbance.