Nitzschia soratensis

-
Category
-
Length Range3-17 µm
-
Width Range2.0-3.3 µm
-
Striae in 10 µm27-30
-
ContributorRosalina Stancheva - Jul 2018
-
ReviewerMarina Potapova, Sarah Spaulding - Jul 2018
Identification


Description
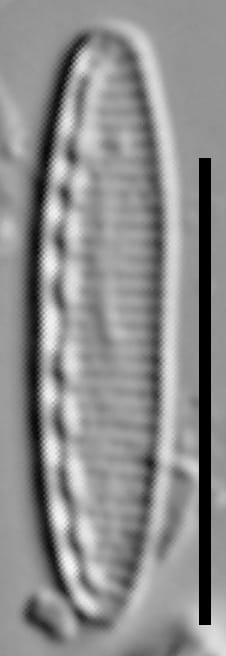
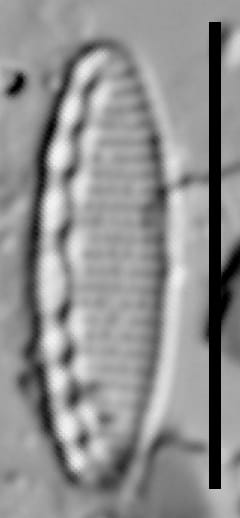
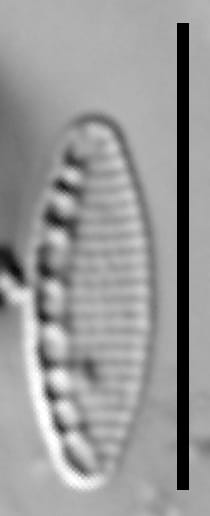
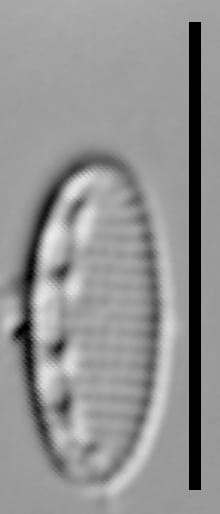
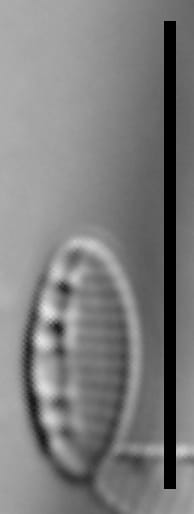
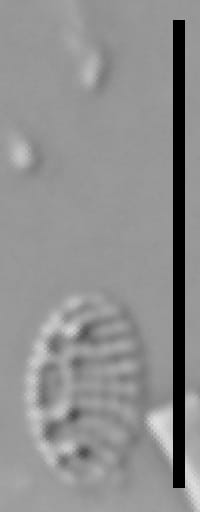
Larger valves are linear, while smaller valves are elliptic. Apices are rounded, but are not protracted or differentiated from the rest of the valve. Fibulae are large, with the middle fibula larger and more distinct than the others. Fibulae number 10-12 in 10 µm. Striae are parallel at the center of the valve, arched near the poles, a feature especially evident in smaller cells. Areolae are visible only in some larger specimens.
In the SEM, striae are composed of single row of circular areolae. Each stria from both valve face and valve mantle terminates in two smaller areolae, in relation to the canal raphe.
This taxon has been commonly confused with N. inconspicua, particularly prior to the recognition of N. soratensis as a distinct taxon (Morales and Vis, 2007). Prior to Hofmann et al. (2011), references did not distinguish N. soratensis from N. inconspicua. Furthermore, N. inconspicua and N. soratensis have different ecologic preferences (Kelly et al. 2015).
Autecology
Field and culture investigations of N. inconspicua and N. soratensis suggest that the two taxa are not closely related and differ in ecological preferences (Trobajo et al. 2013). Based in Trobajo et al., N. soratensis is considered to be strictly freshwater; it only grows well at low salinity and conductance. In contrast, N. inconspicua has a wider tolerance of brackish to freshwater habitats. In rivers of the United Kingdom, the two
species were found growing together in nearly one third of the 46 sampled sites.
Laboratory-based experiments on European collections (Trobajo et al. 2013) suggest that both taxa are indifferent to phosphorus,
at least in the range of 0.016-1.63 mg L−1 P. As a result, it appears that conductivity and/or alkalinity are the main environmental factors driving the differences between these two species in streams. Further suggestions are that these taxa are separated primarily by watershed
geology rather than by anthropogenic nutrient pollution.
This taxon is predicted to disappear from habitats that undergo secondary salinization, that is, with an increase in salinity due to anthropogenic stress (Trobajo et al. 2013).
-
Size Range, µm3
-
Motility
-
Attachment
-
Habitat
-
Colony
-
Occurrence
-
BCG
-
Waterbody
-
Distribution
- Learn more about this
Original Description
Valves with parallel sides and broadly
rounded apices, becoming elliptical in smaller specimens
(Figs 277-280). Frustules rectangular in girdle view with
the canal raphe and fibulae clearly along one margin.
Length: 5.6-15.6; width: 2.4-3.2; striae: 27.5-30 per 10 urn;
fibulae: 10-12.5 per 10 urn. Striae parallel and composed
of round areolae, which are slightly visible in larger specimens (Figs 253-256 and 277-280). The canal raphe runs
along the margin of the valve and a small clear central area
distinguished in some specimens (Figs 279). Fibulae com
posed of small dots or squares and have an extended base at
the valve face interior (Fig. 278).
Remarks. - In the SEM, the areolae are occluded by
cribra, which are not frequently observed probably due to
effects of treatment. The position of the cribra appears to
be mid-way between the outer and inner areolar openings.
Each stria from both valve face and valve mantle ends on
two areolae as it approaches the canal raphe (Figs 277 and 279). The raphe runs along the margin of the valve at the point of transition between the valve face and valve mantle (Fig 279). The central raphe ends do not bend, whereas the terminal ends curve toward the mantle (Fig 279). Each stria ends in an enlarged areola at the valve mantle on the side opposite to where the canal raphe is located (Fig 280). The fibulae are rectangular and fused finger like projections attach them to the interior of the valve mantle and valve face (Plate 29, Fig. 2). The fibulae at the central area are slightly more separated leaving a small clear central area (Fig. 278). The girdle bands are closed and the valvocopulae have one row of wide poroids, which are not visible under LM (Figs 277, 279 and 280).
-
AuthorMorales and Vis 2007
-
Length Range5.6-15.6 µm
-
Width2.4-3.2 µm
-
Striae in 10µm27.5-30
Original Images


Citations & Links
Citations
-
Publication Link: 10.1080/0269249X.2014.951398
-
Publication Link: 10.1127/1438-9134/2017/229
-
Publication Link: 10.1080/00318884.2024.2309855
-
Publication Link: 10.2216/12-077.1
-
Publication Link: 10.1080/0269249X.2012.734531
Links
-
Index Nominum Algarum
-
GenBank
Updates
Jul 14, 2018 - Change of taxon name
From September 20, 2011 to July 7, 2018, the images on this page were associated with the name Nitzschia inconspicua. Following the publication of Morales and Vis (2007) and Kelly et al. (2015), the page was revised to appear as N. soratensis and a new set of images in a new page for N. inconspicua were added. A pdf of the previous version of N. inconspicua is available upon request. - S. Spaulding
Cite This Page
Stancheva, R. (2018). Nitzschia soratensis. In Diatoms of North America. Retrieved June 21, 2026, from https://diatoms.org/species/46734/nitzschia_soratensis
Responses
The 15 response plots show an environmental variable (x axis) against the relative abundance (y axis) of Nitzschia soratensis from all the stream reaches where it was present. Note that the relative abundance scale is the same on each plot. Explanation of each environmental variable and units are as follows:
ELEVATION = stream reach elevation (meters)
STRAHLER = distribution plot of the Strahler Stream Order
SLOPE = stream reach gradient (degrees)
W1_HALL = an index that is a measure of streamside (riparian) human activity that ranges from 0 - 10, with a value of 0 indicating of minimal disturbance to a value of 10 indicating severe disturbance.
PHSTVL = pH measured in a sealed syringe sample (pH units)
log_COND = log concentration of specific conductivity (µS/cm)
log_PTL = log concentration of total phosphorus (µg/L)
log_NO3 = log concentration of nitrate (µeq/L)
log_DOC = log concentration of dissolved organic carbon (mg/L)
log_SIO2 = log concentration of silicon (mg/L)
log_NA = log concentration of sodium (µeq/L)
log_HCO3 = log concentration of the bicarbonate ion (µeq/L)
EMBED = percent of the stream substrate that is embedded by sand and fine sediment
log_TURBIDITY = log of turbidity, a measure of cloudiness of water, in nephelometric turbidity units (NTU).
DISTOT = an index of total human disturbance in the watershed that ranges from 1 - 100, with a value of 0 indicating of minimal disturbance to a value of 100 indicating severe disturbance.
Nitzschia soratensis
- Valves small
- Apices rounded
- Valves linear to elliptic
- Fibulae relatively large
- Striae arched near the poles
Valves are linear to elliptic. The apices are rounded. Fibulae are large, with the middle one larger and more distinct than the others. Striae are parallel at the center of the valve, but arched near the poles, especially in smaller valves.