
Credit: USGS BioData
Distribution of S. hantzschii in rivers of the continental U.S. based on the National Water Quality Assessment program. Retrieved September 9, 2016.


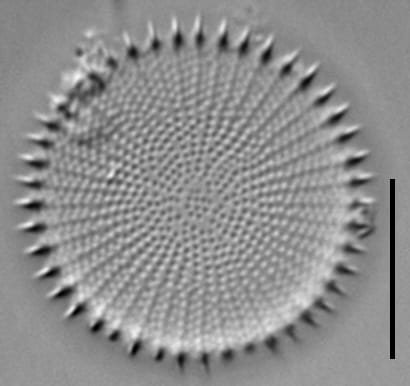
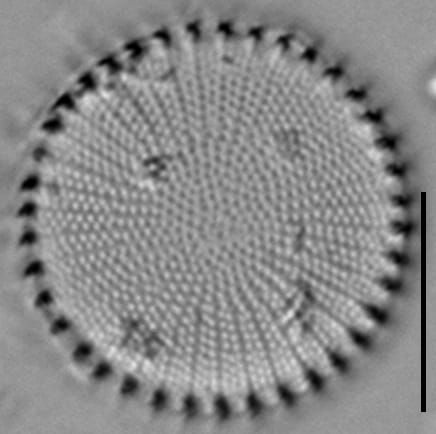
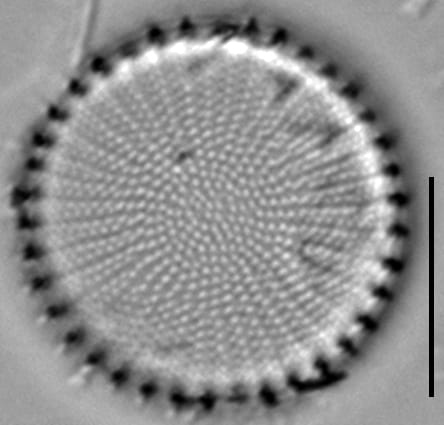
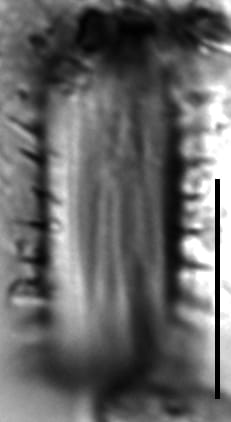
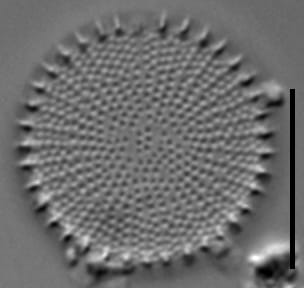
Valves are centric with a flat valve face. Central fultoportulae are absent. Areolae 22 to 25 in 10 µm, easily resolvable in the light microscope. Areolae are arranged in radiate striae, grouped in fascicles. The fascicles are uniseriate at the valve center and become triseriate near the mantle. Several areolae may be grouped into a central annulus. Each interfascicle terminates in a prominent spine. Valve diameter and number of fascicles (37 to 45 per valve) is variable, although not directly related smaller valves do tend to have higher fascicle density. A single rimoportula is present near the valve face mantle junction at the same level of focus as the spine. The external opening of the rimoportula is a tube in the position of a spine, replacing a spine and appearing slightly shorter than a spine.
Stephanodiscus hantzschii is morphologically variable (Håkansson and Stoermer 1984, Kobayasi et al. 1985, Håkansson and Bailey-Watts 1993). The nominate form is described here, and has more heavily silicified valves, straighter fascicles and lower areola density compared to S. hantzschii fo. tenuis. Note, however, that S. hantzschii fo. tenuis was suggested to be an ecophenotype produced as a result of silica limitation (Stoermer et al. 1979).
Stephanodiscus hantzschii is found in the plankton of eutrophic rivers (Reavie and Smol 1998) and lakes (Håkansson and Bailey 1993). Reavie and Kireta (2015) found that among the Laurentian Great Lakes, S. hantzschii was most abundant in riverine and protected wetlands of Lakes Erie and Ontario, and served as a strong indicator of high phosphorus. Stephanodiscus hantzschii can form chain-like colonies (Håkansson and Bailey 1993) linked together by long spines. Stephanodiscus hantzschii is widely regarded as an indicator species dominant in eutrophic lakes (Stoermer and Yang 1969, Anderson 1990, Hall and Smol 1992).


Burge, D., Edlund, M. (2016). Stephanodiscus hantzschii. In Diatoms of North America. Retrieved July 21, 2026, from https://diatoms.org/species/51740/stephanodiscus_hantzschii
The 15 response plots show an environmental variable (x axis) against the relative abundance (y axis) of Stephanodiscus hantzschii from all the stream reaches where it was present. Note that the relative abundance scale is the same on each plot. Explanation of each environmental variable and units are as follows:
ELEVATION = stream reach elevation (meters)
STRAHLER = distribution plot of the Strahler Stream Order
SLOPE = stream reach gradient (degrees)
W1_HALL = an index that is a measure of streamside (riparian) human activity that ranges from 0 - 10, with a value of 0 indicating of minimal disturbance to a value of 10 indicating severe disturbance.
PHSTVL = pH measured in a sealed syringe sample (pH units)
log_COND = log concentration of specific conductivity (µS/cm)
log_PTL = log concentration of total phosphorus (µg/L)
log_NO3 = log concentration of nitrate (µeq/L)
log_DOC = log concentration of dissolved organic carbon (mg/L)
log_SIO2 = log concentration of silicon (mg/L)
log_NA = log concentration of sodium (µeq/L)
log_HCO3 = log concentration of the bicarbonate ion (µeq/L)
EMBED = percent of the stream substrate that is embedded by sand and fine sediment
log_TURBIDITY = log of turbidity, a measure of cloudiness of water, in nephelometric turbidity units (NTU).
DISTOT = an index of total human disturbance in the watershed that ranges from 1 - 100, with a value of 0 indicating of minimal disturbance to a value of 100 indicating severe disturbance.