Surirella pinnata

-
Category
-
Length Range18-71 µm
-
Width Range8.5-14 µm
-
Striae in 10 µm25-32
-
Reported AsSurirella minuta (Krammer and Lange-Bertalot 1987)
-
ContributorJonathan English - Feb 2011
-
ReviewerSam Rushforth - Apr 2011
Identification


Description
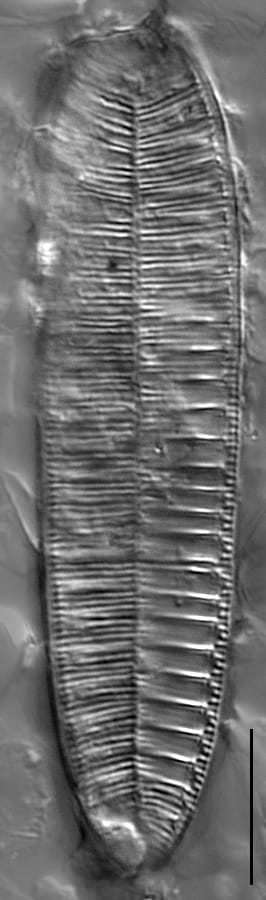
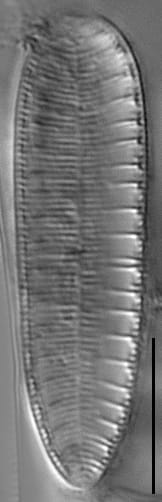
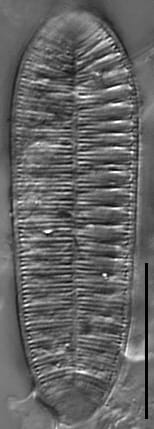
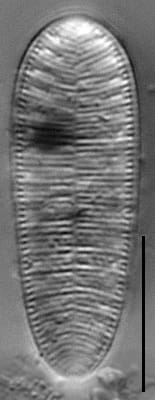
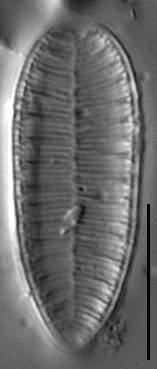
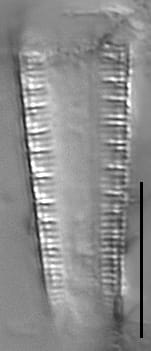
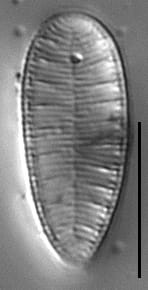
Valve length to width ratio is between 2 and 5. The keel is low and alar canals are not visible. The headpole is slightly broader and rounder than the footpole. Apices are broadly rounded and the valve sides are straight,tapering slightly toward the footpole. Fibulae 9-12 in 10 μm, extending from the mantle to the midline. Costae are fine, 25-32 in 10 µm, extending from the valve margin to the midline. Every third or fourth costa is raised, 6-9 in 10 µm. Between the costae there are 3-5 rows of areolae only visible with SEM.
Autecology
This taxon cam be confused with S. minuta and S. lacrimula and the records shown on this page may include all three species. Records of S. minuta in North America are uncertain and specimens should be carefully examined. These taxa are more abundant in streams that have been more impacted by increased amounts of fine sediments and nutrients.
-
Size Range, µm3
-
Motility
-
Attachment
-
Habitat
-
Colony
-
Occurrence
-
BCG
-
Waterbody
-
Distribution
- Learn more about this
Original Description
-
AuthorW.Smith 1853
-
Length Range15-33 µm
Original Images


Citations & Links
Citations
-
Publication Link: 10.1080/0269249X.2011.642950
-
Publication Link: 10.1080/0269249X.1987.9704986
Links
-
Index Nominum Algarum
Updates
May 10, 2020 - Clarification of identity
From February 2011 to May 2020, this page appeared as Surirella minuta. English and Potapova (2012) examined the type material of both S. pinnata and S. minuta, and concluded that that specimens illustrated on this page belong to S. pinnata as they possess the long fibulae characteristic of S. pinnata. The name of the page was revised to reflect our revised understanding of the species. - M. Potapova
Cite This Page
English, J. (2011). Surirella pinnata. In Diatoms of North America. Retrieved June 24, 2026, from https://diatoms.org/species/45778/surirella_pinnata
Responses
The 15 response plots show an environmental variable (x axis) against the relative abundance (y axis) of Surirella pinnata from all the stream reaches where it was present. Note that the relative abundance scale is the same on each plot. Explanation of each environmental variable and units are as follows:
ELEVATION = stream reach elevation (meters)
STRAHLER = distribution plot of the Strahler Stream Order
SLOPE = stream reach gradient (degrees)
W1_HALL = an index that is a measure of streamside (riparian) human activity that ranges from 0 - 10, with a value of 0 indicating of minimal disturbance to a value of 10 indicating severe disturbance.
PHSTVL = pH measured in a sealed syringe sample (pH units)
log_COND = log concentration of specific conductivity (µS/cm)
log_PTL = log concentration of total phosphorus (µg/L)
log_NO3 = log concentration of nitrate (µeq/L)
log_DOC = log concentration of dissolved organic carbon (mg/L)
log_SIO2 = log concentration of silicon (mg/L)
log_NA = log concentration of sodium (µeq/L)
log_HCO3 = log concentration of the bicarbonate ion (µeq/L)
EMBED = percent of the stream substrate that is embedded by sand and fine sediment
log_TURBIDITY = log of turbidity, a measure of cloudiness of water, in nephelometric turbidity units (NTU).
DISTOT = an index of total human disturbance in the watershed that ranges from 1 - 100, with a value of 0 indicating of minimal disturbance to a value of 100 indicating severe disturbance.
Surirella pinnata
- Keel low, alar wings absent
- Valves slightly heteropolar
- Valve margins nearly straight
- Each 3rd or 4th costa raised
- Fibulae extend from the mantle nearly to midline
The valves are slightly heteropolar, with rounded apices. Valve margins are nearly straight, tapering toward the narrower pole (footpole). Fibulae extend from the mantle nearly to the midline, with a density of 9-12 in 10 μm. The costae are dense at 25-32 in 10 µm. Every 3rd or 4th costa is raised.