Navicula pseudotenelloides

-
Category
-
Length Range18-25 µm
-
Width Range2.7-3.3 µm
-
Striae in 10 µm13-14
-
ContributorMarina Potapova, Sylvia Leppik - Dec 2024
-
ReviewerSarah Spaulding - Jan 2025
Identification

Description
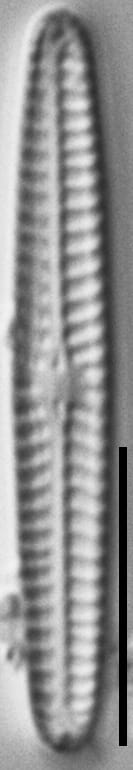
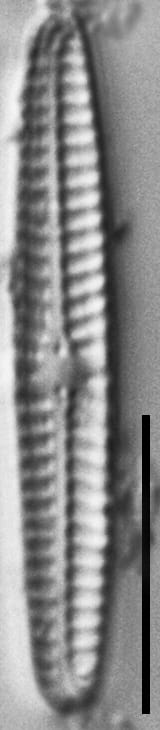
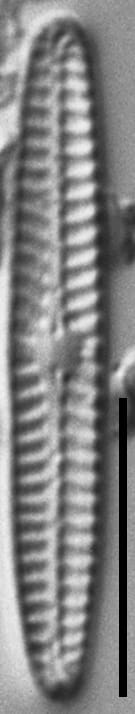
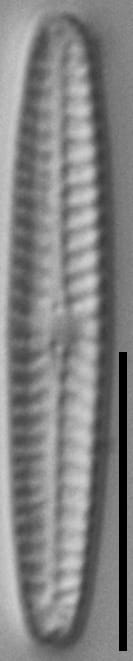
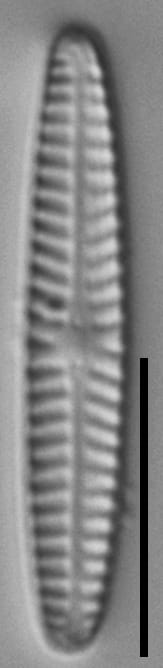
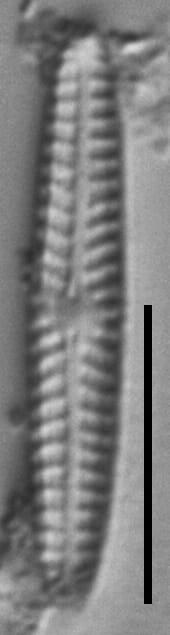
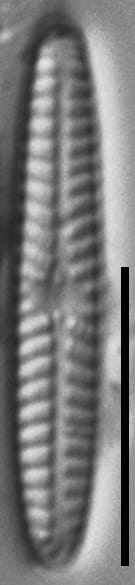
Valves are linear, with rounded ends. The raphe is straight and filiform. The axial area is linear and narrow. The central area is small, formed by one or two shortened striae on each valve side. Striae are radiate in the central valve and weakly convergent at the apices. Areolae are indistinguishable under LM.
Note that specimens shown on this page are from Alaska. They are more narrow (2.9-3.2 µm) than specimens of the Spitsbergen type population (3.0-4.5 µm) (Krasske 1938). Similarly, Lange-Bertalot (2001) published images of wider specimens (3.2-3.6 µm).
Autecology
Lange-Bertalot (2001) noted that this taxon is only known from arctic and subarctic regions. He illustrated specimens from Spitsbergen and Siberia. Specimens illustrated here are from two freshwater locations in the vicinity of Point Barrow, Alaska, and originated from Leonard Freese's 1959 collection (Patrick and Freese 1961).
-
Size Range, µm3
-
Motility
-
Attachment
-
Habitat
-
Colony
-
Occurrence
-
Waterbody
- Learn more about this
Original Description
-
AuthorKrasske 1938
-
Length Range18-21 µm
-
Width3.5-4 µm
-
Striae in 10µm14
Original Images

Citations & Links
Citations
Links
-
DiatomBase
Cite This Page
Potapova, M., Leppik, S. (2024). Navicula pseudotenelloides. In Diatoms of North America. Retrieved July 24, 2026, from https://diatoms.org/species/62299/navicula-pseudotenelloides
Responses
The 15 response plots show an environmental variable (x axis) against the relative abundance (y axis) of Navicula pseudotenelloides from all the stream reaches where it was present. Note that the relative abundance scale is the same on each plot. Explanation of each environmental variable and units are as follows:
ELEVATION = stream reach elevation (meters)
STRAHLER = distribution plot of the Strahler Stream Order
SLOPE = stream reach gradient (degrees)
W1_HALL = an index that is a measure of streamside (riparian) human activity that ranges from 0 - 10, with a value of 0 indicating of minimal disturbance to a value of 10 indicating severe disturbance.
PHSTVL = pH measured in a sealed syringe sample (pH units)
log_COND = log concentration of specific conductivity (µS/cm)
log_PTL = log concentration of total phosphorus (µg/L)
log_NO3 = log concentration of nitrate (µeq/L)
log_DOC = log concentration of dissolved organic carbon (mg/L)
log_SIO2 = log concentration of silicon (mg/L)
log_NA = log concentration of sodium (µeq/L)
log_HCO3 = log concentration of the bicarbonate ion (µeq/L)
EMBED = percent of the stream substrate that is embedded by sand and fine sediment
log_TURBIDITY = log of turbidity, a measure of cloudiness of water, in nephelometric turbidity units (NTU).
DISTOT = an index of total human disturbance in the watershed that ranges from 1 - 100, with a value of 0 indicating of minimal disturbance to a value of 100 indicating severe disturbance.
Navicula pseudotenelloides
- Valves linear
- Apices rounded
- Axial area narrow
- Central area small
Valves are linear, with rounded ends. The axial area is linear and very narrow. The central area is small, formed by one or two shortened striae on each side of the valve.